Tech M&A valuations - US vs. Europe
Last updated on 28 March 2025
Table of Contents
About this report
🇺🇸 US-based companies across software, fintech, consumer and digital health were acquired for an average of 34% higher multiple than 🇪🇺 European ones between 2020-2025.
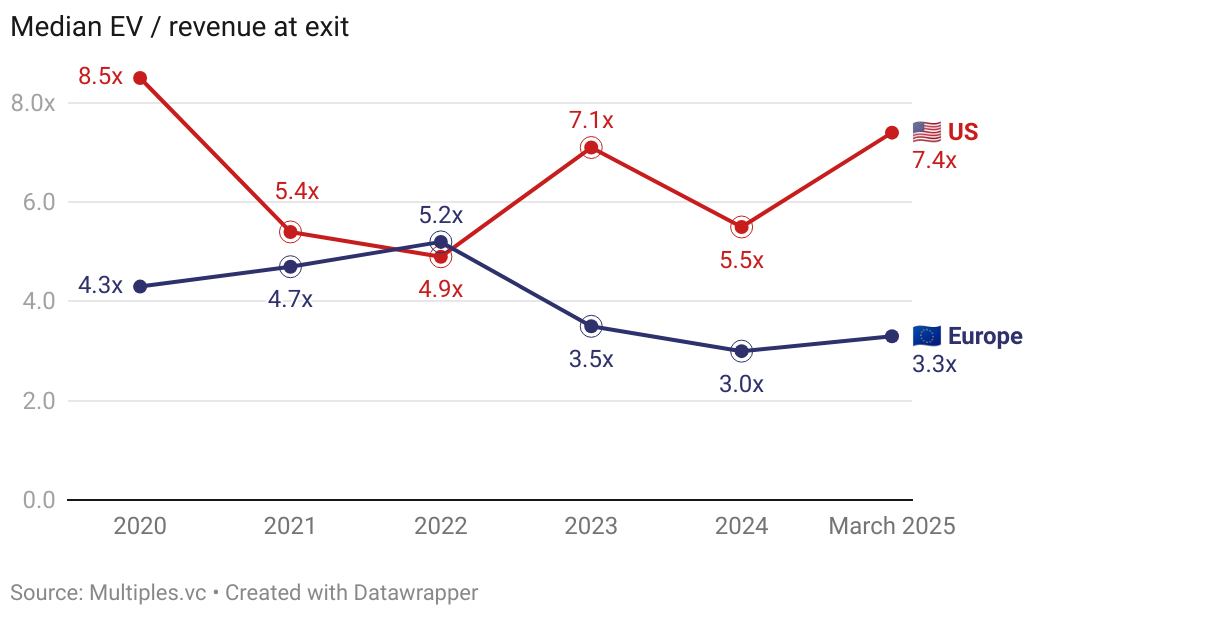
Big valuation differences especially in fintech (3.5x, 3.0x for Europe vs. 7.1x, 5.5x for the US in 2023 and 2024 respectively).
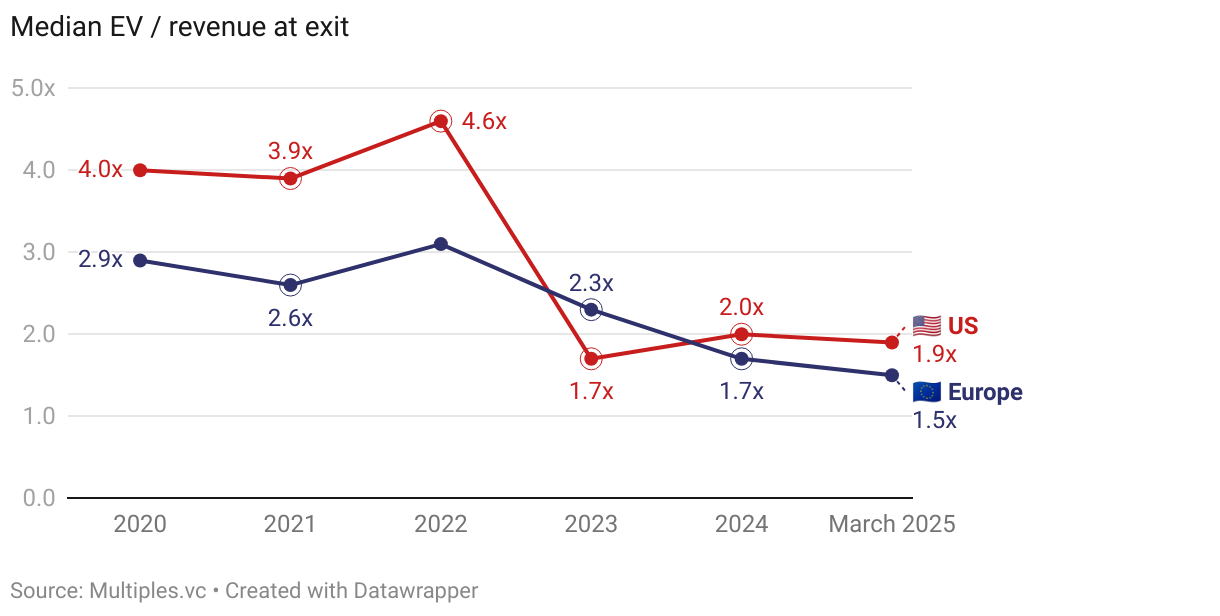
Huge drop in consumer tech valuations for both regions post-ZIRP era (from 4.6x in 2022 to 1.7x in 2023 for the US companies).
Scroll below to read the interactive version of this report, or download the PDF here.
This analysis is available to download as a PDF presentation, get it below 👇
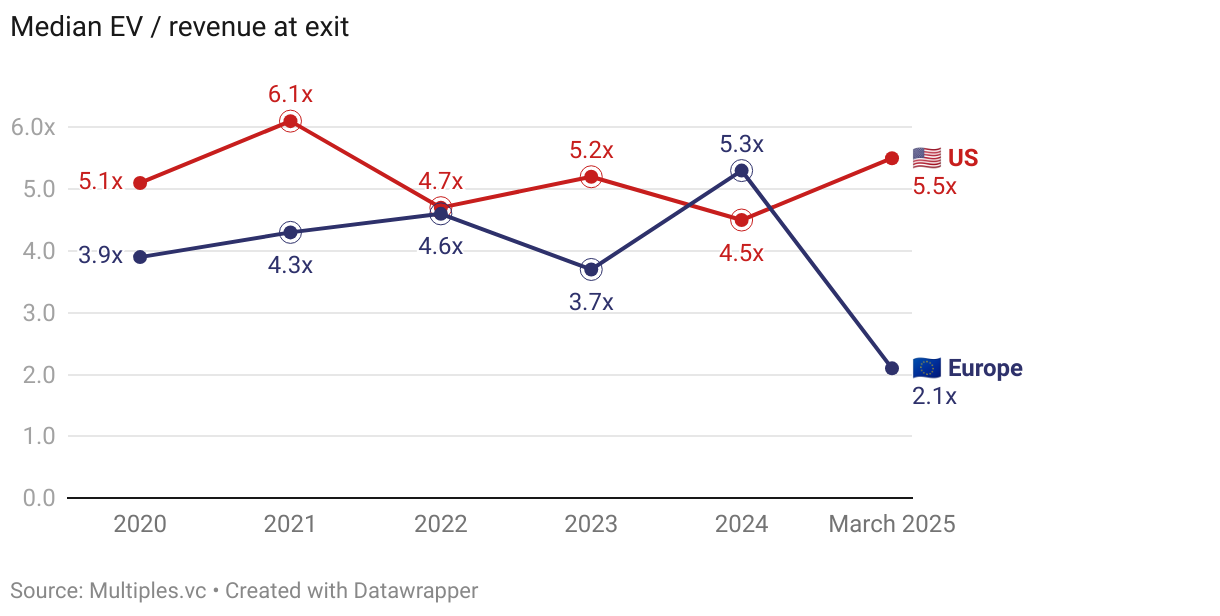
Download PDFSoftware M&A exit multiples
As of March 2025, software M&A exit multiples in the US are 168% higher than in Europe.
Fintech M&A exit multiples
Fintech M&A exit valuation multiples in the US are nearly 90% higher than in Europe.
Consumer tech M&A exit multiples
Consumer tech M&A exit valuation multiples dropped across both regions since ZIRP-era highs, but US valuations are still 27% higher than in Europe.
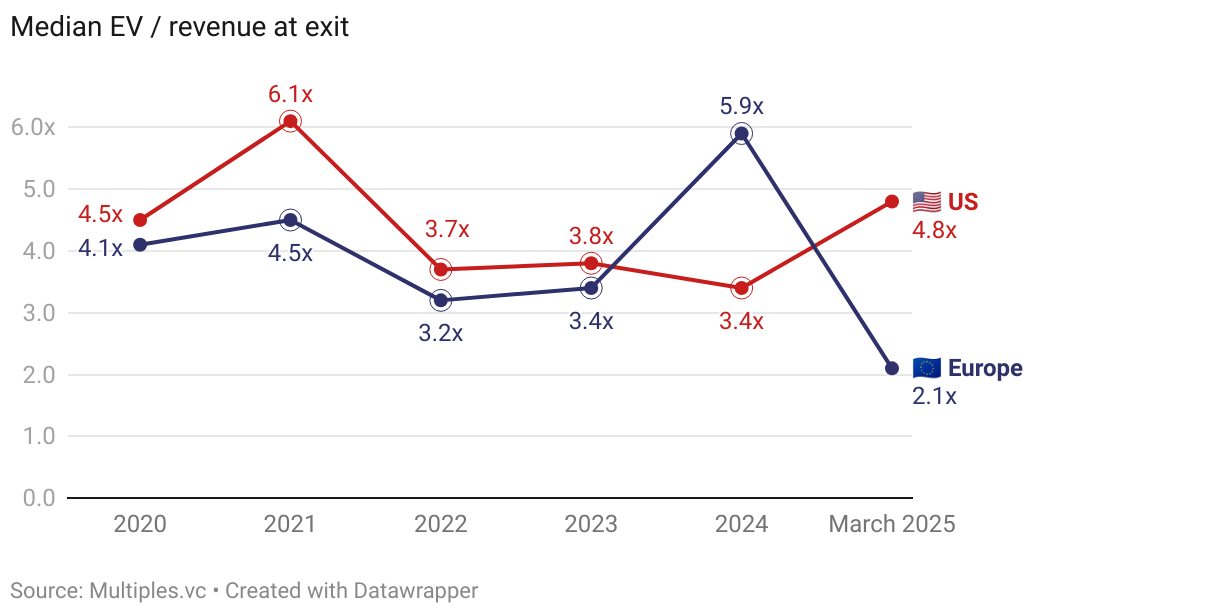
HealthTech M&A exit multiples
Lots of volatility in health tech M&A valuation multiples, latest medians show 2x for Europe and nearly 5x for the US.
Data and methodology
Underlying data
Multiples is a valuation analytics platform. Public markets data is powered by FactSet and Morningstar, harmonized and enhanced by us. Private transaction data is multi-sourced, aggregated from harvesting public information, agreements with 3rd party providers, proprietary sourcing and data engineering. All data is verified and provided with an extensive manual process (no AI involved). This report is built on data that is available at multiples.vc. For more information, please visit multiples.vc or contact us at hi@multiples.vc.
Public companies
The foundation of our public comps are analyst estimates and historical financials, powered by FactSet (consensus analyst estimates) and Morningstar (historical data). Analyst estimates are provided by FactSet by taking input from 50+ equity research analysts (the highest amount across all financial data providers). Data points are calendarized to December where relevant: retrieved data on financial year ends (e.g. FY, FY+1 etc.) are mapped to calendar years (2024A, 2025E etc.) before the appropriate month weights are then applied to prior/future fundamentals. We emphasise valuation multiples and operational ratios, any raw figures are harmonised to USD for comparison purposes.
Private transactions
We source deal data from 3rd party databases, company filings, press releases, and our own proprietary data sets built over years of investment banking careers. We harmonize and unify data in-house to form a unique data set of disclosed transactions. We triple-check deal data through a proprietary red-flagging system, compare with verified online sources, and sense-check with our investment banking team. We exclude undisclosed and suspicious-looking data points. Our dataset is continuously monitored for accuracy. EV calculation: if data permits, we apply our own logic to get to the EV. For example, for a large M&A deal with available information on the target's net debt, we might adjust a valuation to fully reflect an accurate EV. In all other cases, we take the reported valuation as the numerator. Financials: we source LTM revenue and LTM EBITDA data from company filings, press releases, or other verified sources. If LTM data is unavailable, we take the 'next best-fit' period (run-rate or calendar year), provided it makes sense in a given case. For example, if a deal closed in November 2024, we might take full-year 2024 revenue as a revenue benchmark.