Software Valuation Multiples - September 2025
Last updated on 02 September 2025Table of Contents
About this report
Software valuation multiples in September 2025 show clear segmentation across infrastructure, vertical, and horizontal categories, with significant dispersion in both revenue and EBITDA multiples reflecting varying market maturity and profitability profiles.
Vertical software comps trade in a compressed range from 2.0x for travel & hospitality to 4.8x for public sector and professional services software, while horizontal SaaS comps show the widest dispersion from 1.4x for video streaming to 5.4x for ERP software. Public investors are valuing software companies based on AI application (or death risk due to AI disruption), technical complexity, market position, and specialization depth - rather than TAM size alone.
Read more on software valuation multiples in our latest report below 👇
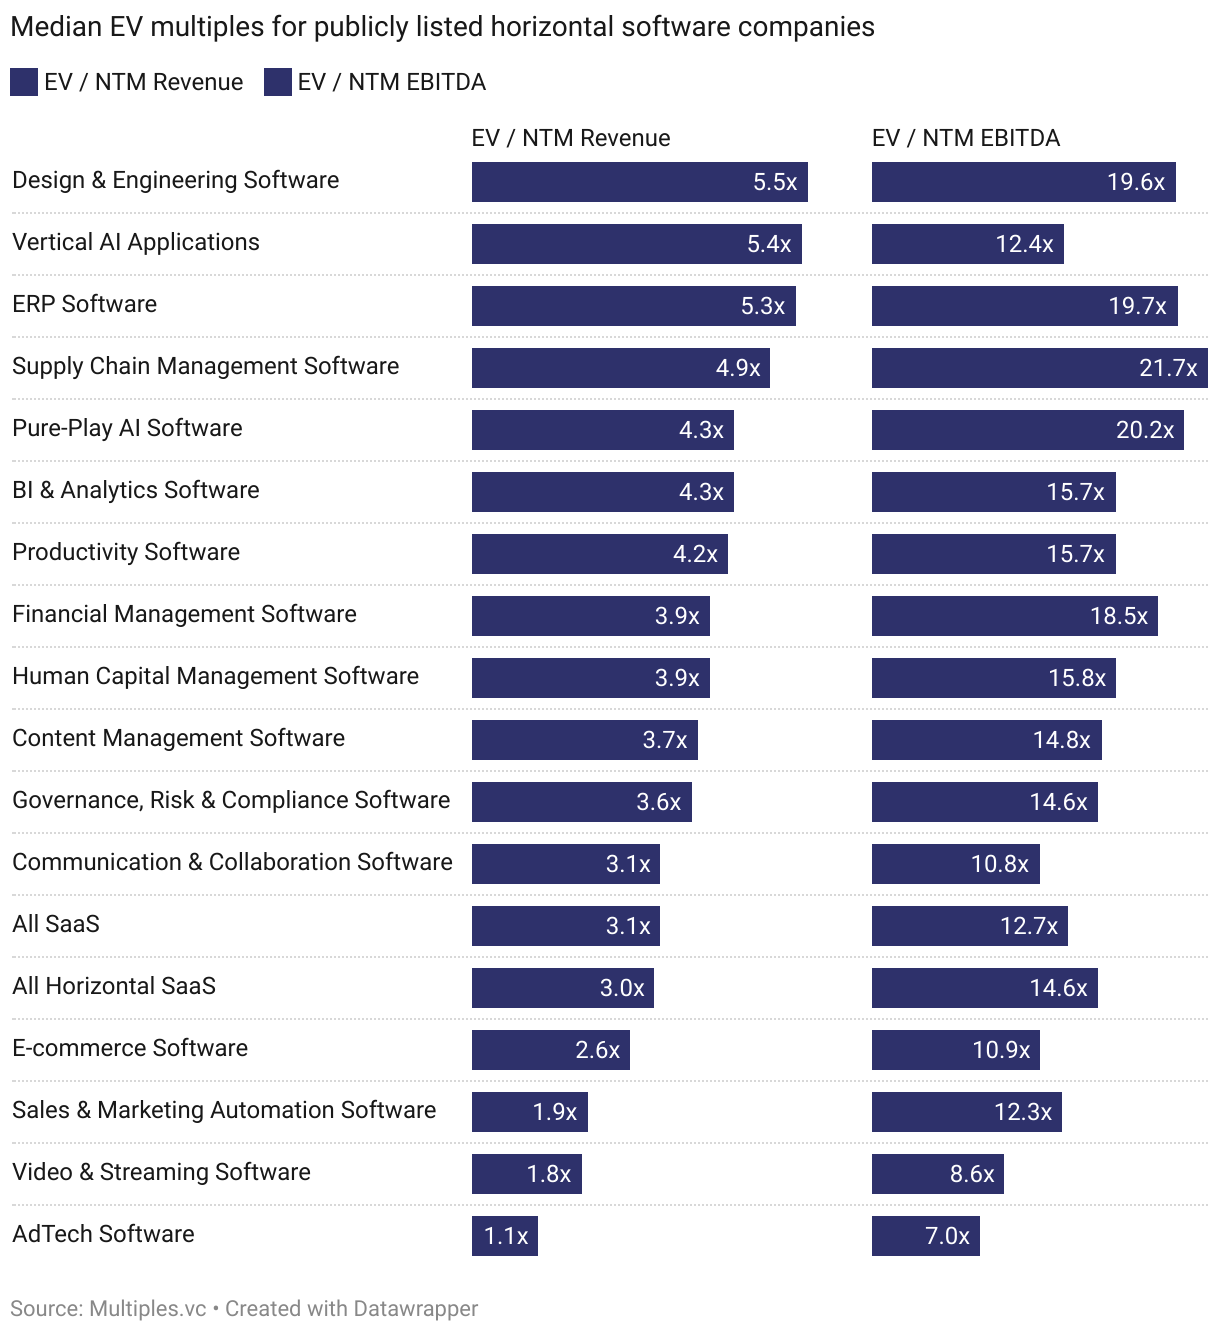
Public Horizontal SaaS
Horizontal SaaS public comps show wide valuation randes which hints at AI's 'creative destruction', with design/engineering software maintaining 5.2x revenue multiples as companies like Autodesk and Adobe integrate AI without cannibalizing core products, while sales/marketing automation trades at 2.3x (generative AI threatens to replace traditional CRM workflows). AdTech (1.2x) and video streaming (1.4x) trade below-market reflecting not just competition but fundamental (but not recent) business model issues - huge platform risks for MarTech, and unsustainable infrastructure costs that consume 80% of revenues for streaming.
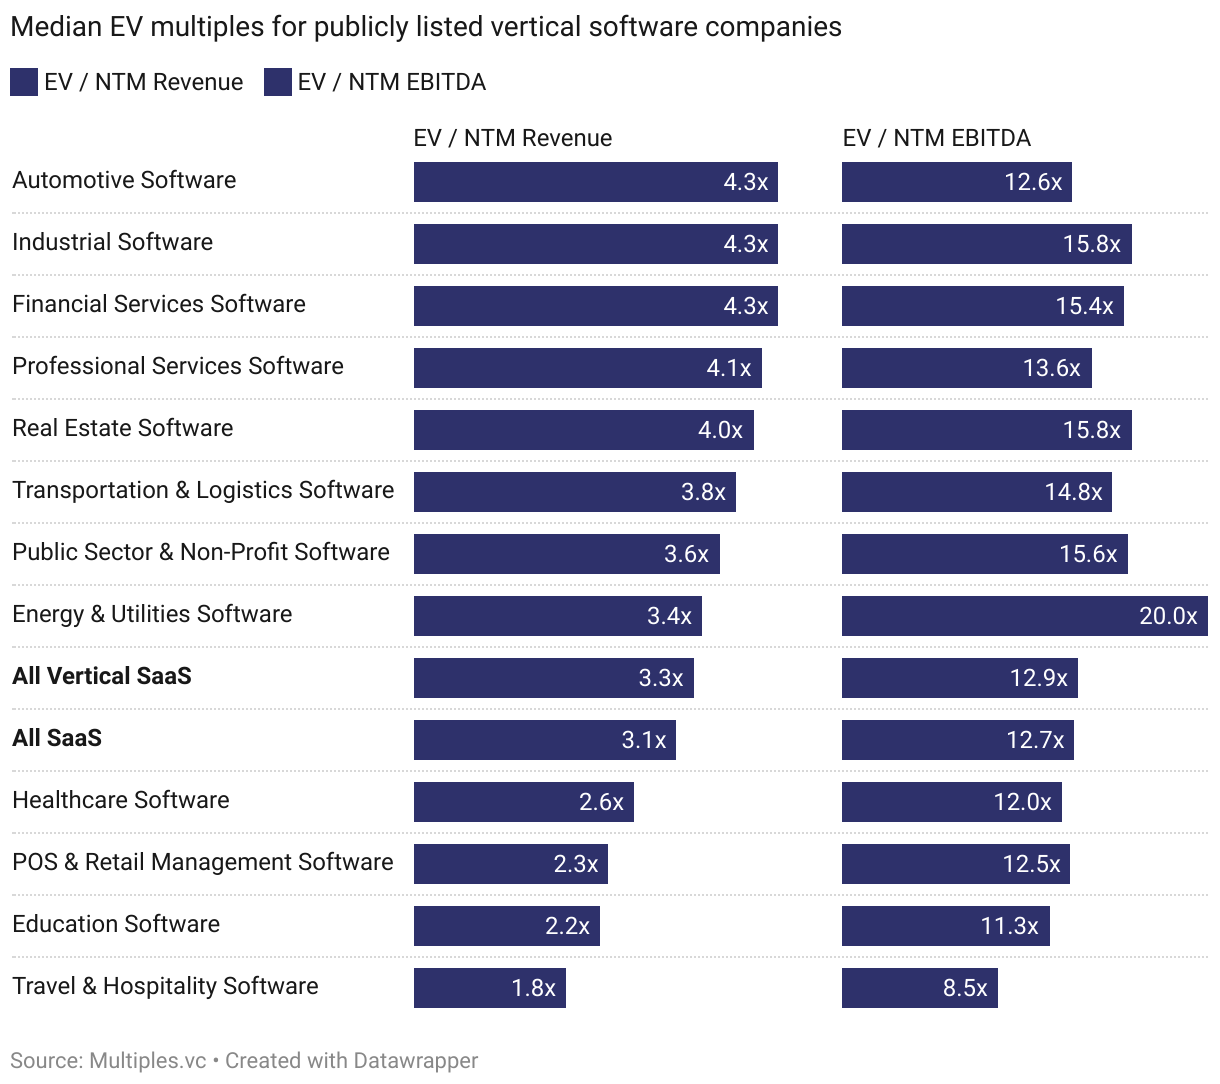
Public Vertical SaaS
In September 2025, vertical software comps (3.3x) slightly outperform horizontal SaaS (3.1x). Industry-specific software tends to naturally createdeeper customer relationships and higher switching costs than vanilla horizontal SaaS. Automotive software leads the pack at 4.6x revenue multiple, while healthcare closes the group at 2.6x revenue multiple.
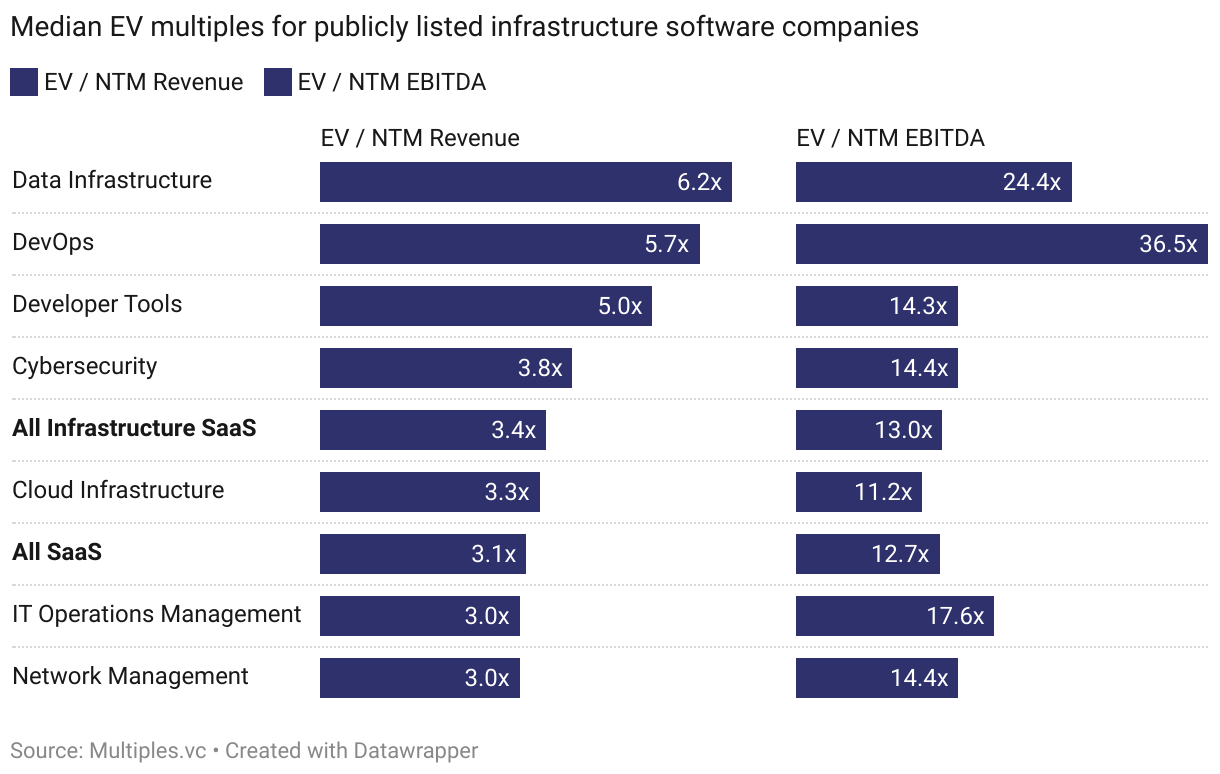
Public Infrastructure SaaS
As of September 2025, infrastructure software SaaS public companies commands the highest valuations across all categories, with data infrastructure at 6.5x revenue reflecting the AI data boom where companies like Snowflake and Databricks are seeing double-digit growth rates as enterprises build AI-ready data stacks. DevOps also trades high at 5.6x revenue multiple (enjoying sticky enterprise contracts and the projected $81B DevOps market value by 2033). The relatively low cloud infrastructure multiples might suggest investors see this segment as increasingly commoditized.
Data and methodology
Underlying data
Multiples is a valuation analytics platform. Public markets data is powered by FactSet and Morningstar, harmonized and enhanced by us. Private transaction data is multi-sourced, aggregated from harvesting public information, agreements with 3rd party providers, proprietary sourcing and data engineering. All data is verified and provided with an extensive manual process (no AI involved). This report is built on data that is available at multiples.vc. For more information, please visit multiples.vc or contact us at hi@multiples.vc.
Public companies
The foundation of our public comps are analyst estimates and historical financials, powered by FactSet (consensus analyst estimates) and Morningstar (historical data). Analyst estimates are provided by FactSet by taking input from 50+ equity research analysts (the highest amount across all financial data providers). Data points are calendarized to December where relevant: retrieved data on financial year ends (e.g. FY, FY+1 etc.) are mapped to calendar years (2024A, 2025E etc.) before the appropriate month weights are then applied to prior/future fundamentals. We emphasise valuation multiples and operational ratios, any raw figures are harmonised to USD for comparison purposes.
Private transactions
We source deal data from 3rd party databases, company filings, press releases, and our own proprietary data sets built over years of investment banking careers. We harmonize and unify data in-house to form a unique data set of disclosed transactions. We triple-check deal data through a proprietary red-flagging system, compare with verified online sources, and sense-check with our investment banking team. We exclude undisclosed and suspicious-looking data points. Our dataset is continuously monitored for accuracy. EV calculation: if data permits, we apply our own logic to get to the EV. For example, for a large M&A deal with available information on the target's net debt, we might adjust a valuation to fully reflect an accurate EV. In all other cases, we take the reported valuation as the numerator. Financials: we source LTM revenue and LTM EBITDA data from company filings, press releases, or other verified sources. If LTM data is unavailable, we take the 'next best-fit' period (run-rate or calendar year), provided it makes sense in a given case. For example, if a deal closed in November 2024, we might take full-year 2024 revenue as a revenue benchmark.