Communications Sector Update
Last updated on 30 June 2025
Table of Contents
-
Market Update
- What is the telecom market size?
- What is global mobile internet penetration?
- How is 5G commercialisation progressing?
- How does 5G adoption differ between developed and emerging markets?
- How is global network traffic growing?
- What is the data center supply and demand outlook?
- How large is the IoT market?
-
Public Comps
- Which telecom verticals trade at the highest EV/revenue multiples?
- How have EV/revenue multiples evolved across telecom verticals?
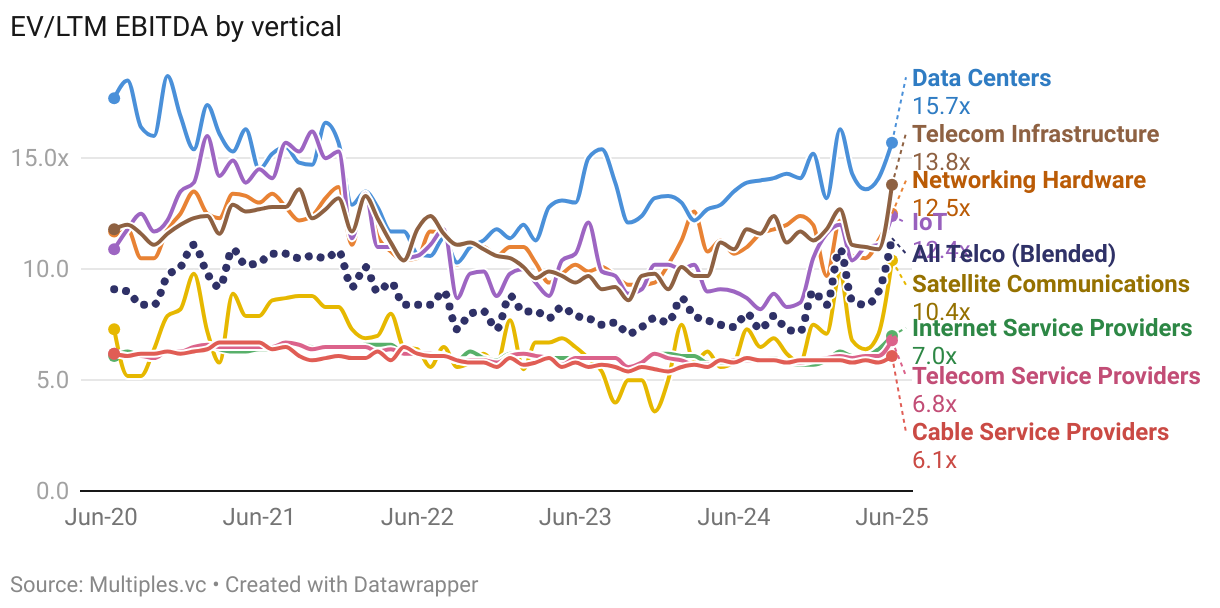
- Which telecom verticals command the highest EV/EBITDA multiples?
- How have EBITDA multiples evolved across telecom verticals?
- How do telecom EV/revenue multiples vary by region?
- How do telecom EBITDA multiples compare across regions?
- What are current telecom sector valuations?
- How do growth rates and margins compare across telecom sectors?
- What is the expense structure across telecom sectors?
- Which telecom stocks performed best and worst in Q2 2025?
- M&A Activity
-
VC Activity
- How much VC funding telecom startups raised in Q2 2025?
- How is telecom VC funding distributed across stages?
- Which telecom sectors attract the most VC funding?
- How is telecom VC funding distributed globally?
- How many telecom VC rounds happened in Q2 2025?
- How are telecom VC rounds distributed by stage?
- Data and methodology
About this report
There has never been more demand for data and computing, driven by 5G commercialisation, AI developments and explosion in digital content.
(Tele)communications sector is undergoing fundamental structural transformation as traditional telecom operators pivot from connectivity providers to digital infrastructure platforms. We're witnessing consolidation activity, with dealmakers targeting both revenue diversification and operational scale. Portfolio optimization remains a defining theme, as operators divest non-core assets while acquiring capabilities in AI, edge computing, and enterprise services to capture higher-margin opportunities.
Scroll below to read the interactive version of this report, or download the PDF here.
This analysis is available to download as a PDF presentation, get it below 👇
Download PDFMarket Update
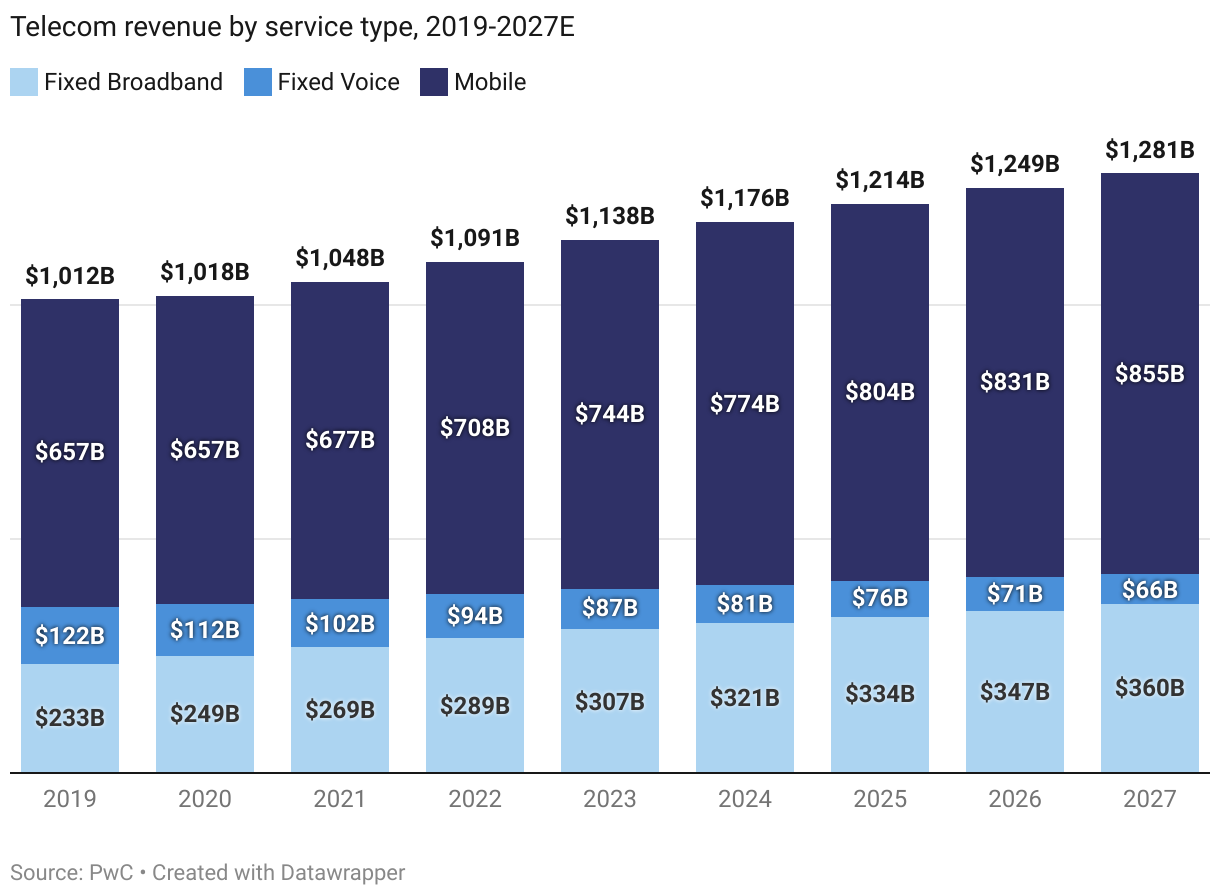
What is the telecom market size?
Telecommunications industry is steadily growing though in a (very) slow pace, expected to grow by CAGR 2.9% and reach $1.3T by 2028.
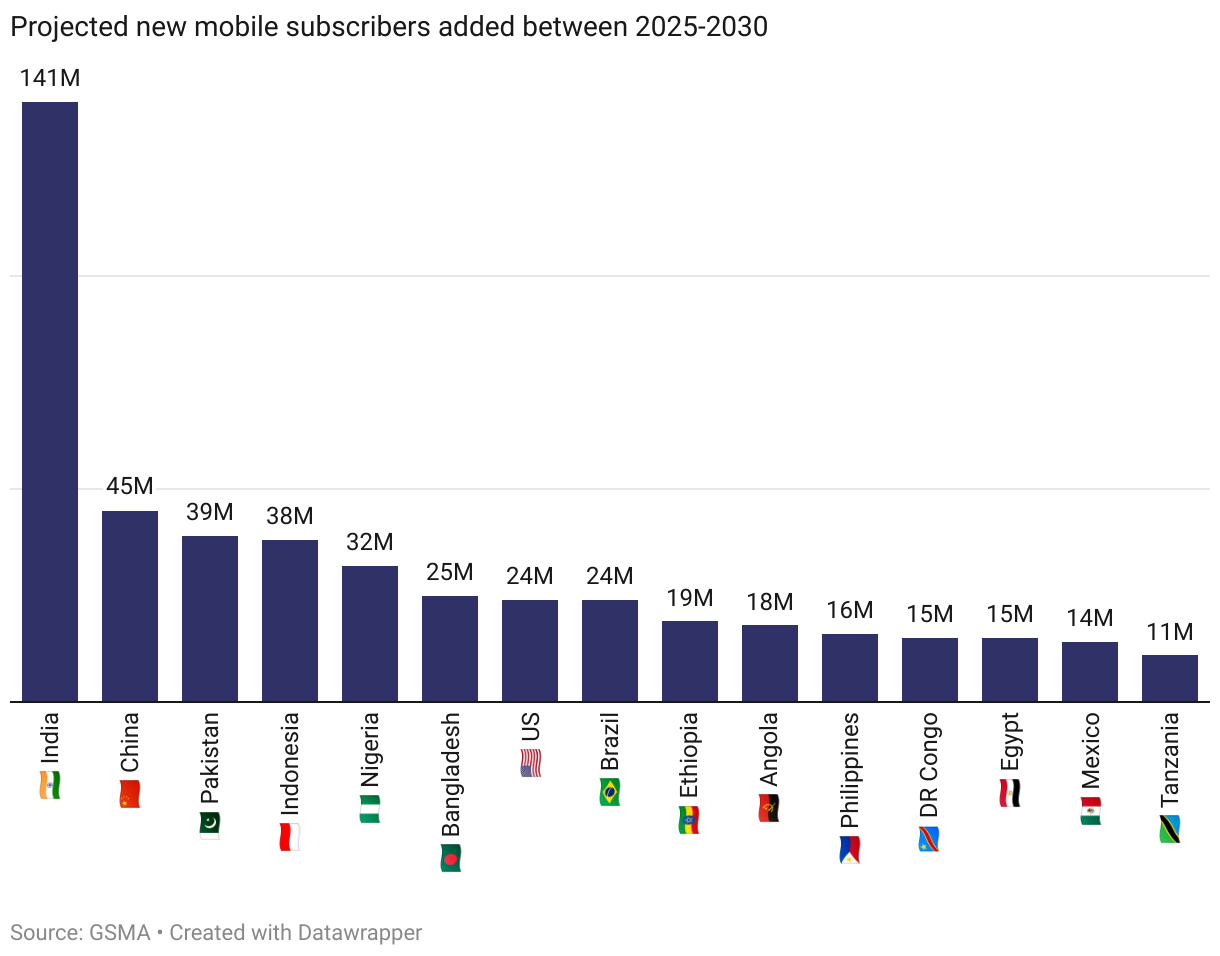
What is global mobile internet penetration?
Nearly 60% of the world has now access to mobile internet, and while high-income regions saturated, emerging markets growth is clearly visible.
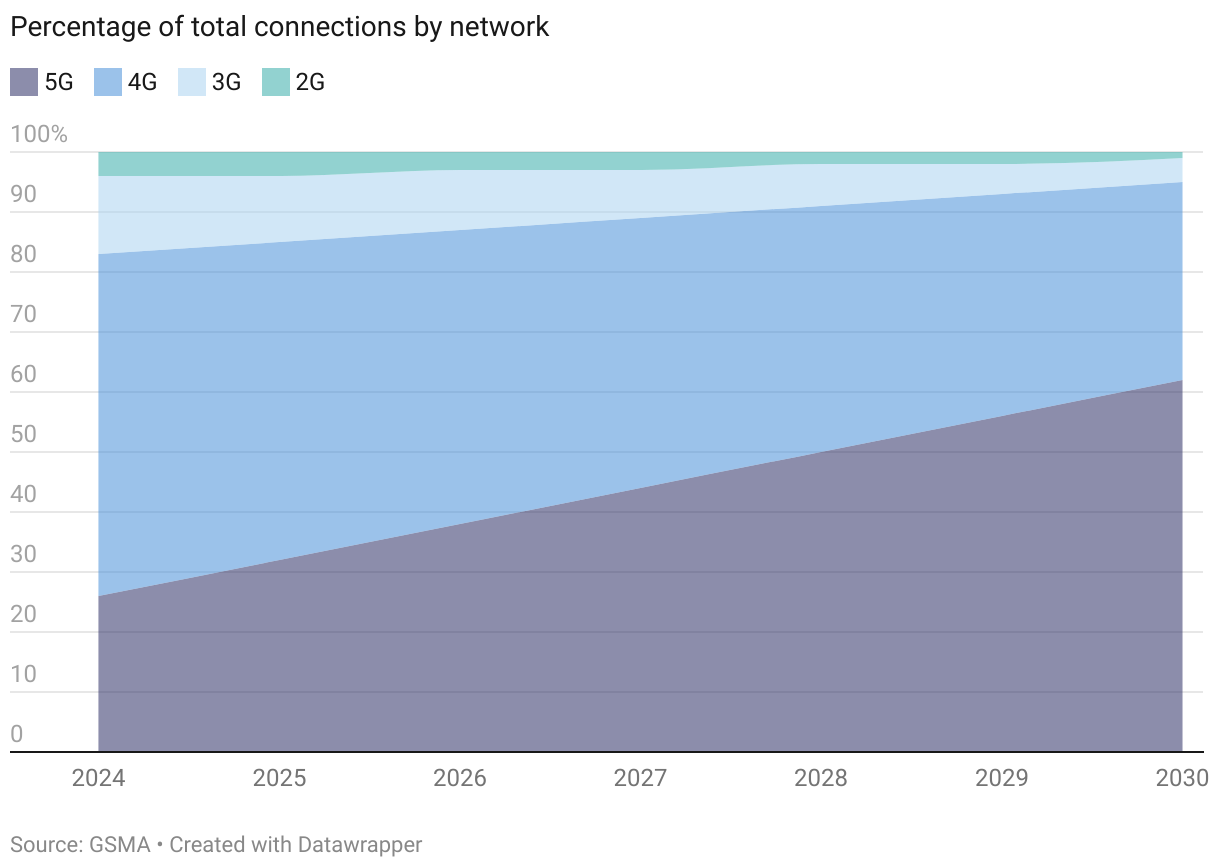
How is 5G commercialisation progressing?
5G commercialisation picks up pace and by 2028 5G will account for over a half of all mobile subscriptions.
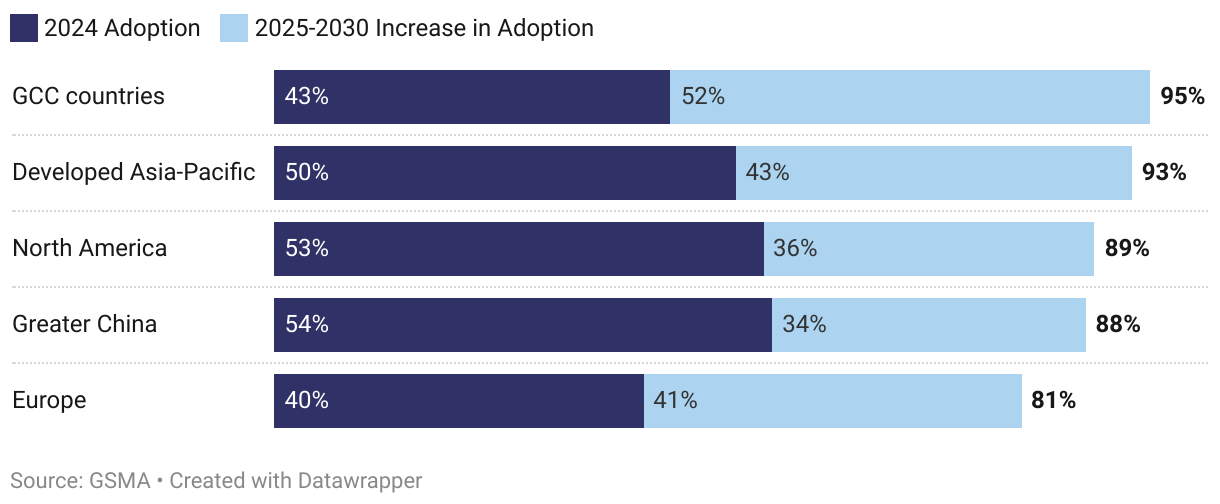
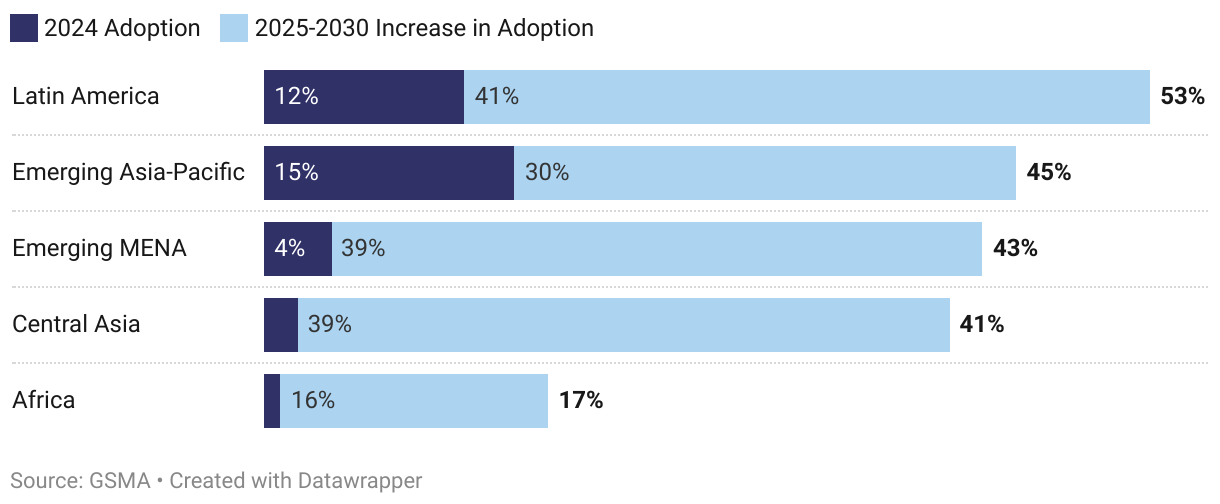
How does 5G adoption differ between developed and emerging markets?
5G already accounts for over 50% of mobile connections in North America, China and developed APAC, emerging markets still way to go but expected to follow (cheaper phones and new spectrum assignments).
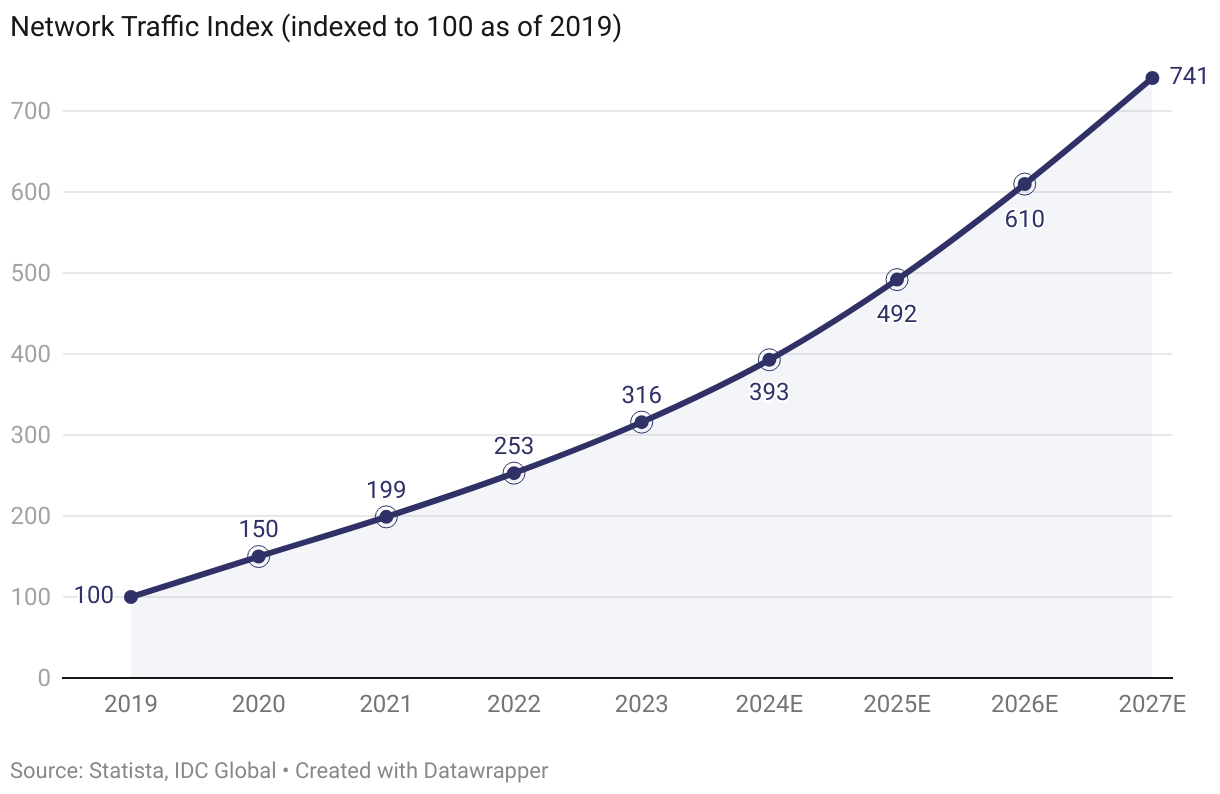
How is global network traffic growing?
Data demand is sky-high, driven by generative AI craze, increase in IoT devices, cloud computing growth, and the explosion in digital content.
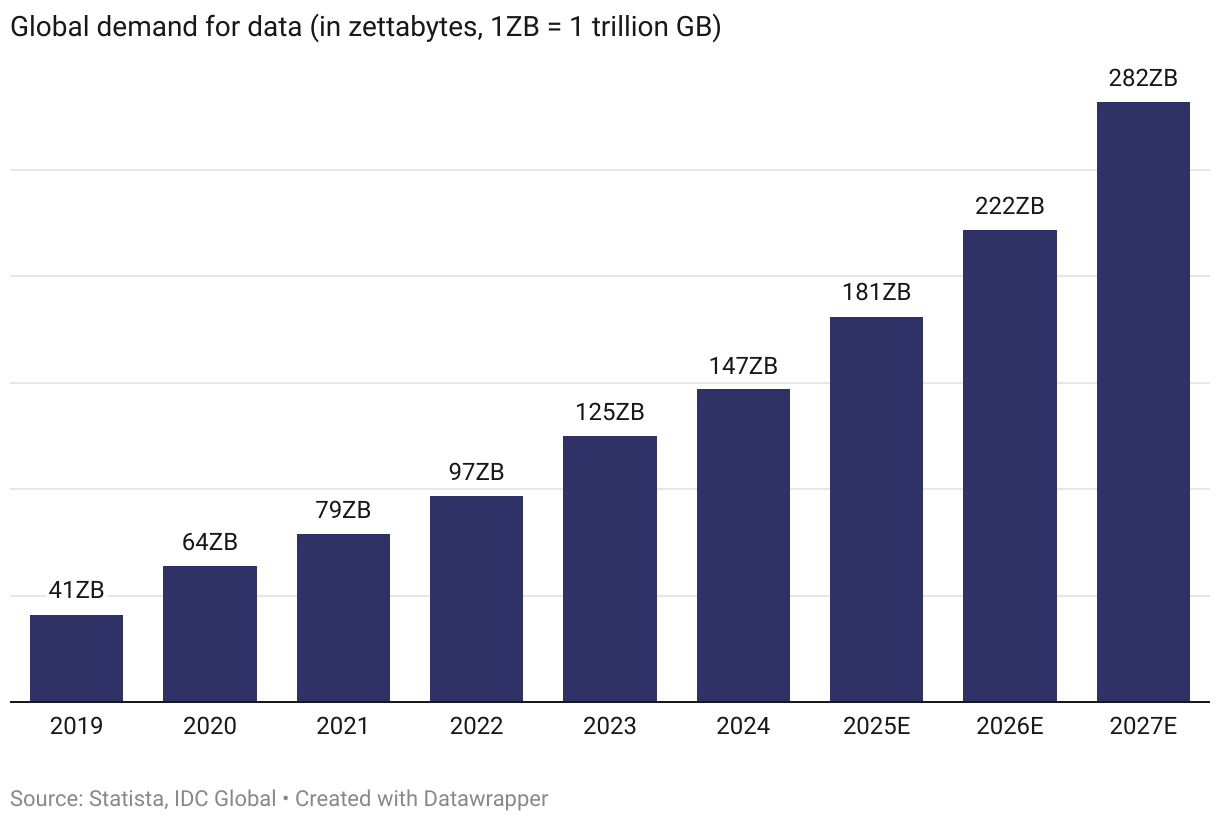
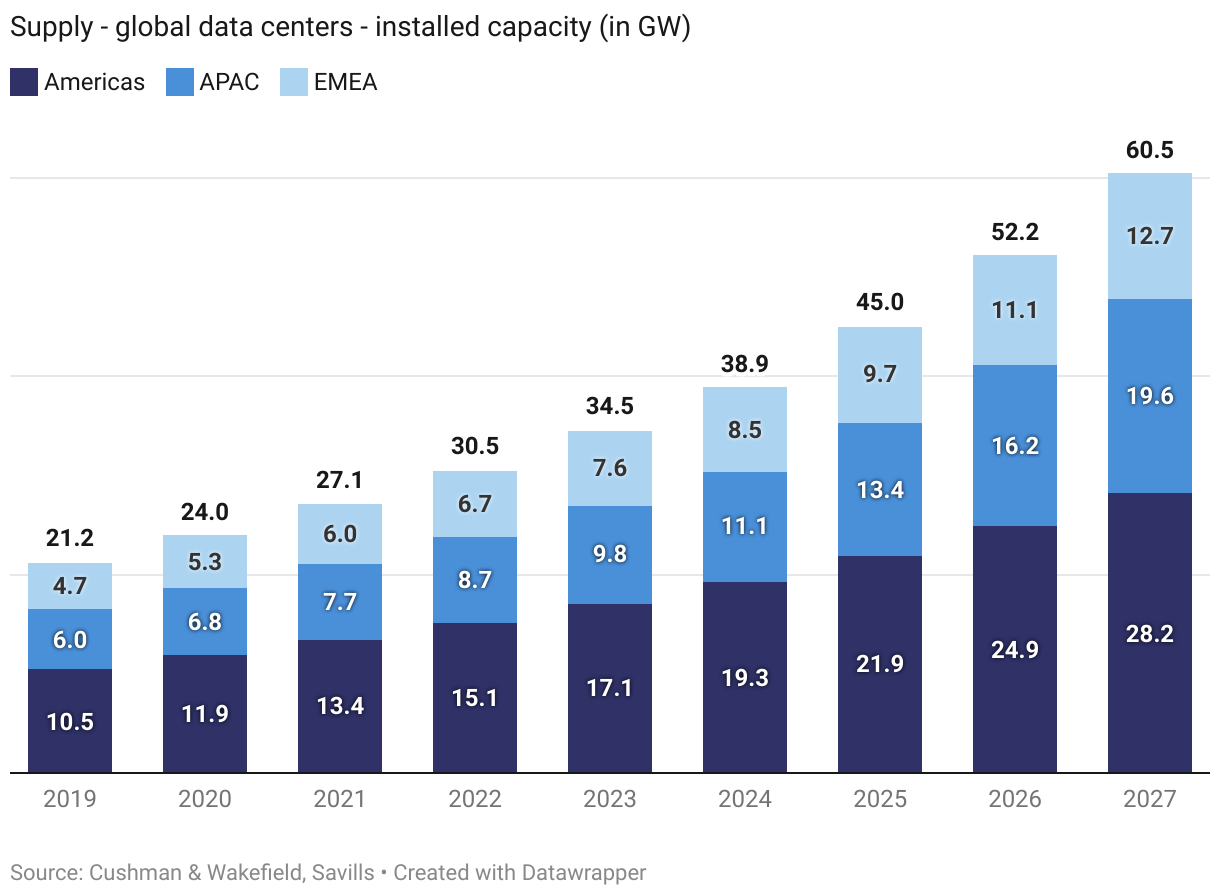
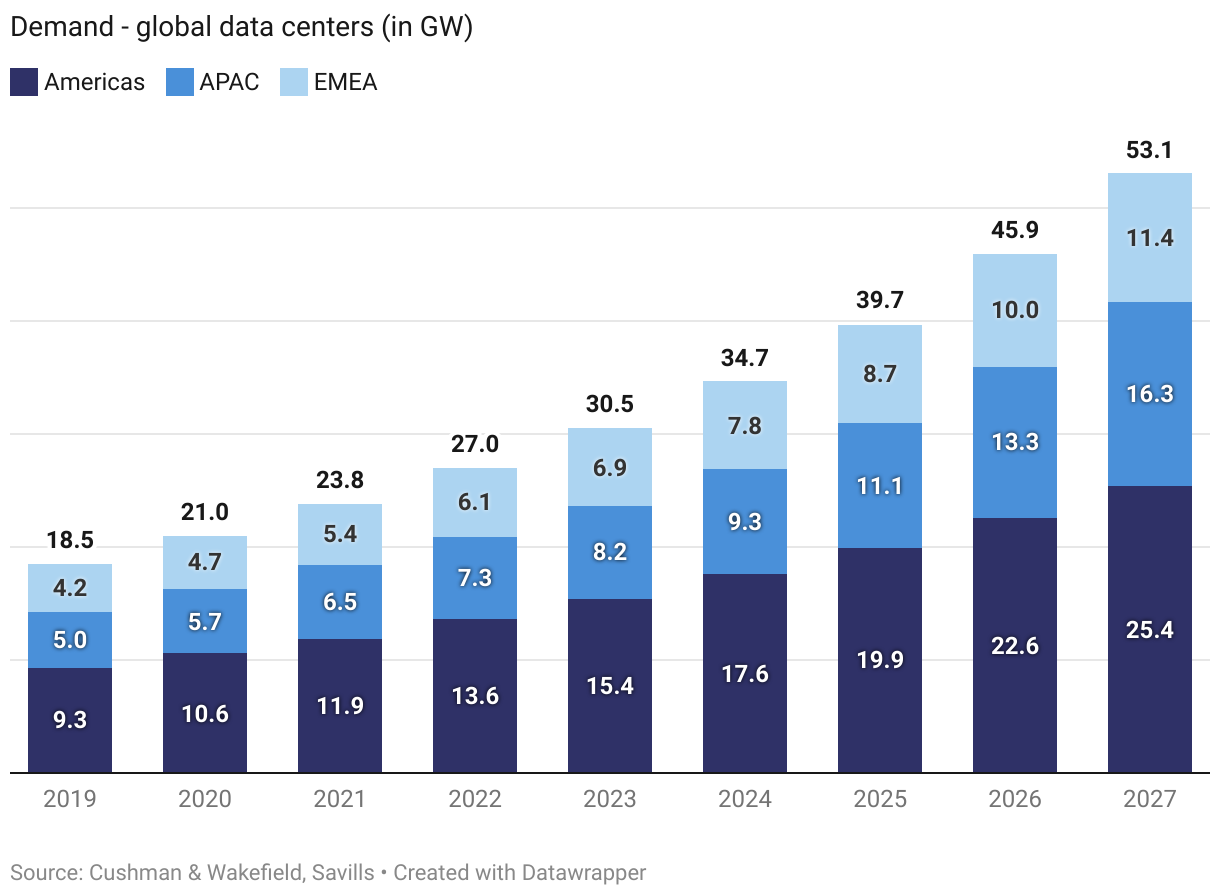
What is the data center supply and demand outlook?
Money flows into data centers infrastructure, global DC supply expected to reach 60 GW, while demand projected to hit 53 GW by 2027.
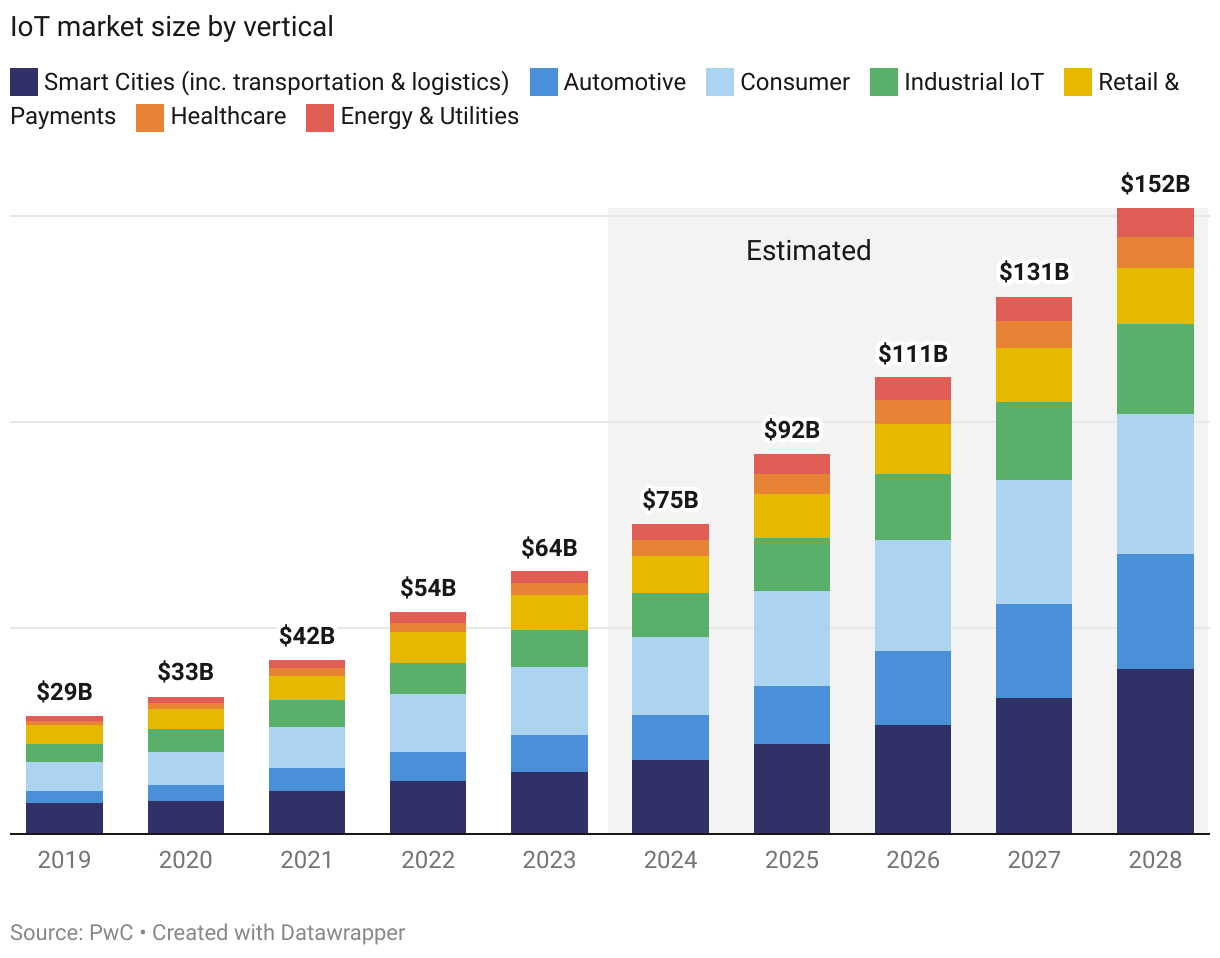
How large is the IoT market?
IoT space is rapidly growing, driven by smart cities initiatives, digitization of logistics and connected automotive tech.
Public Comps
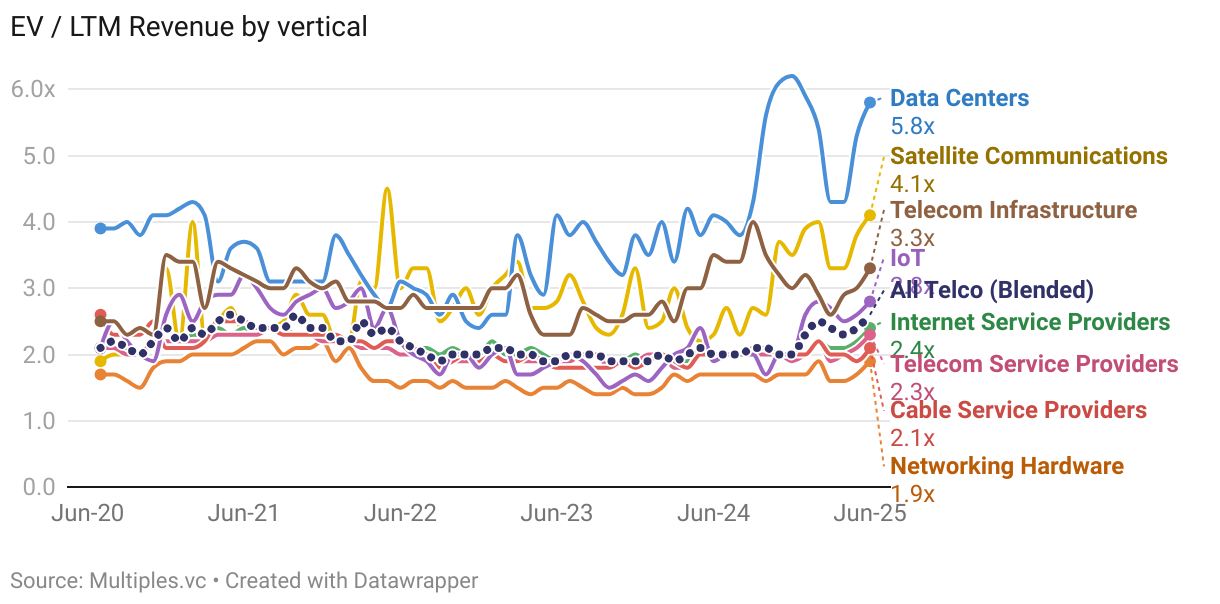
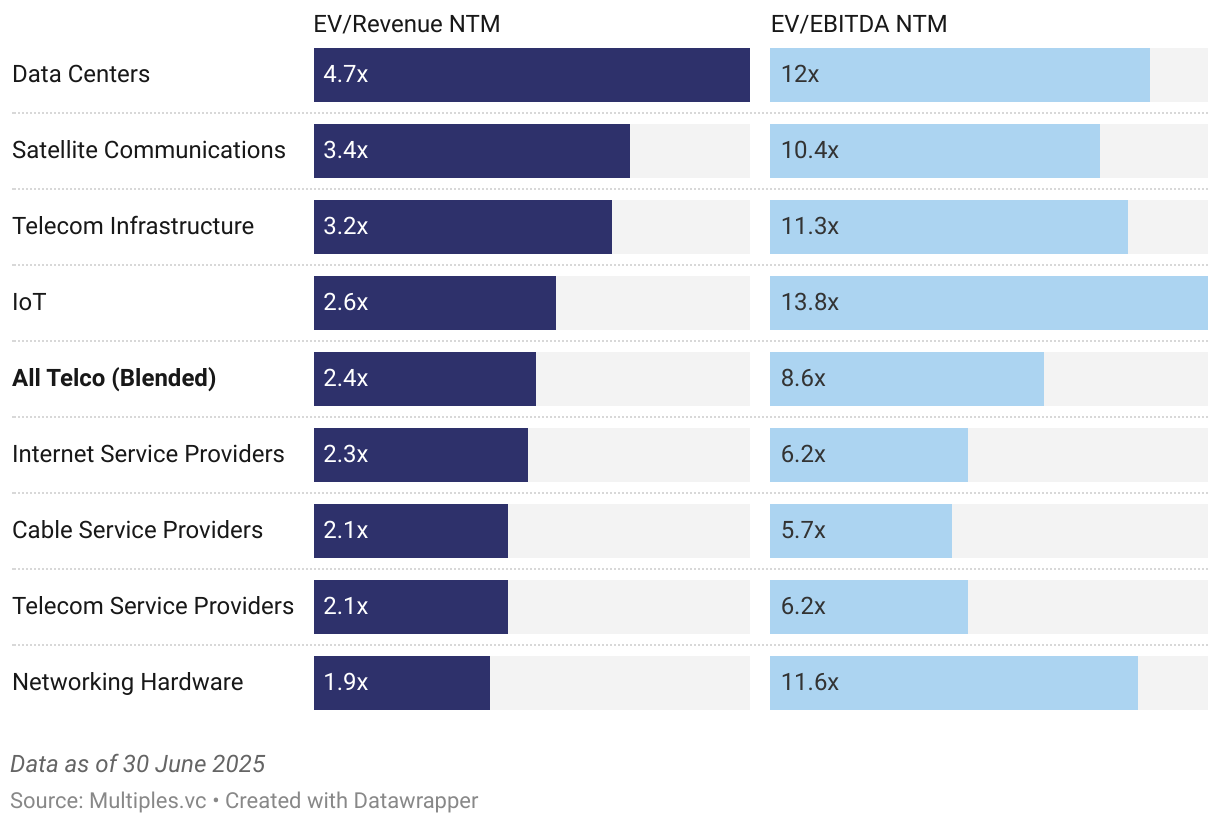
Which telecom verticals trade at the highest EV/revenue multiples?
Data center comps trade at premium, riding the AI wave, benefitting from increasing cloud computing needs, rapidly growing data usage.
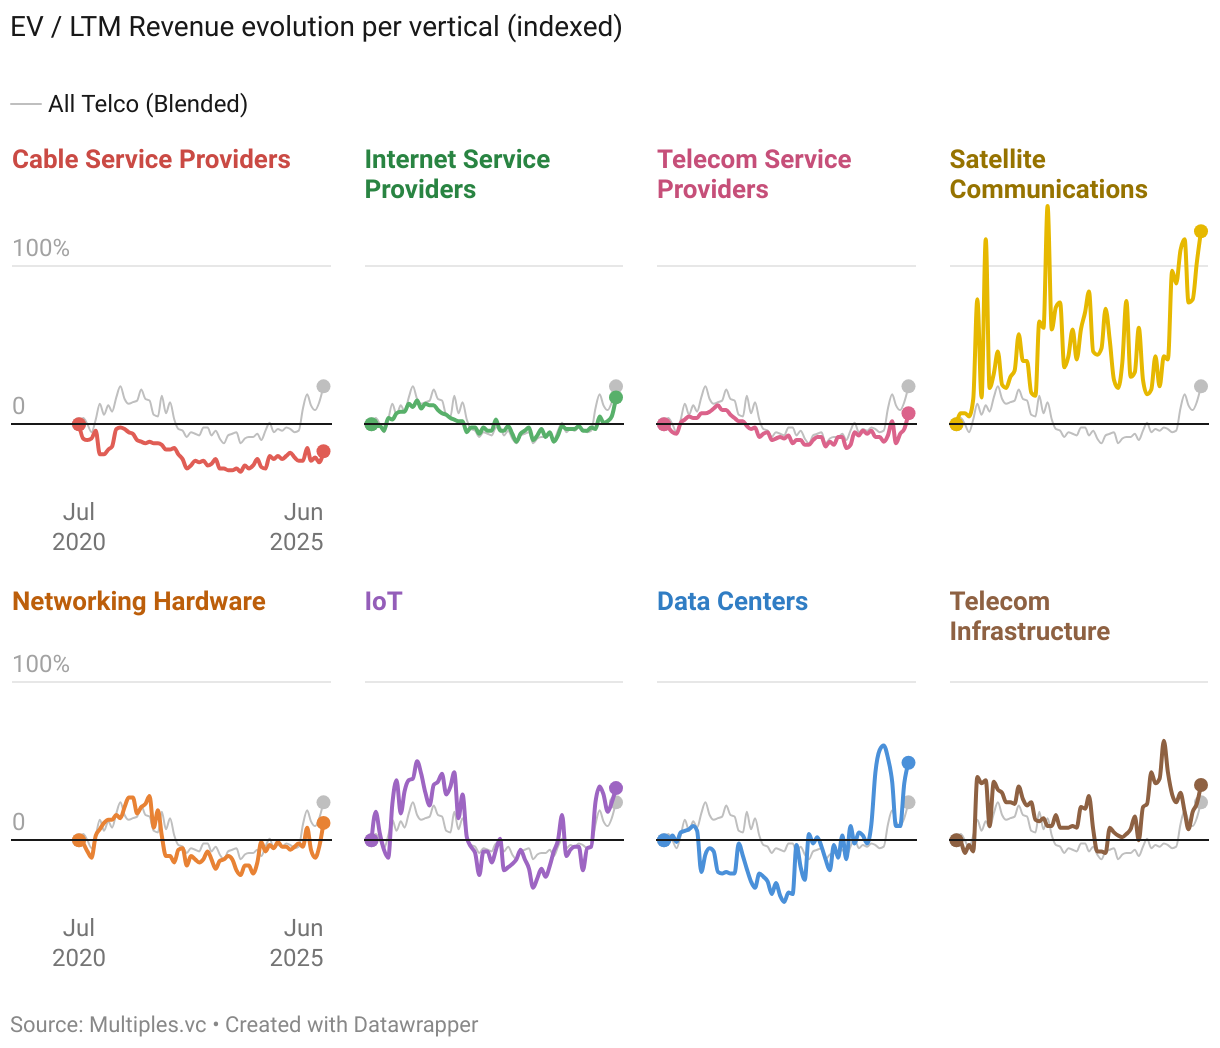
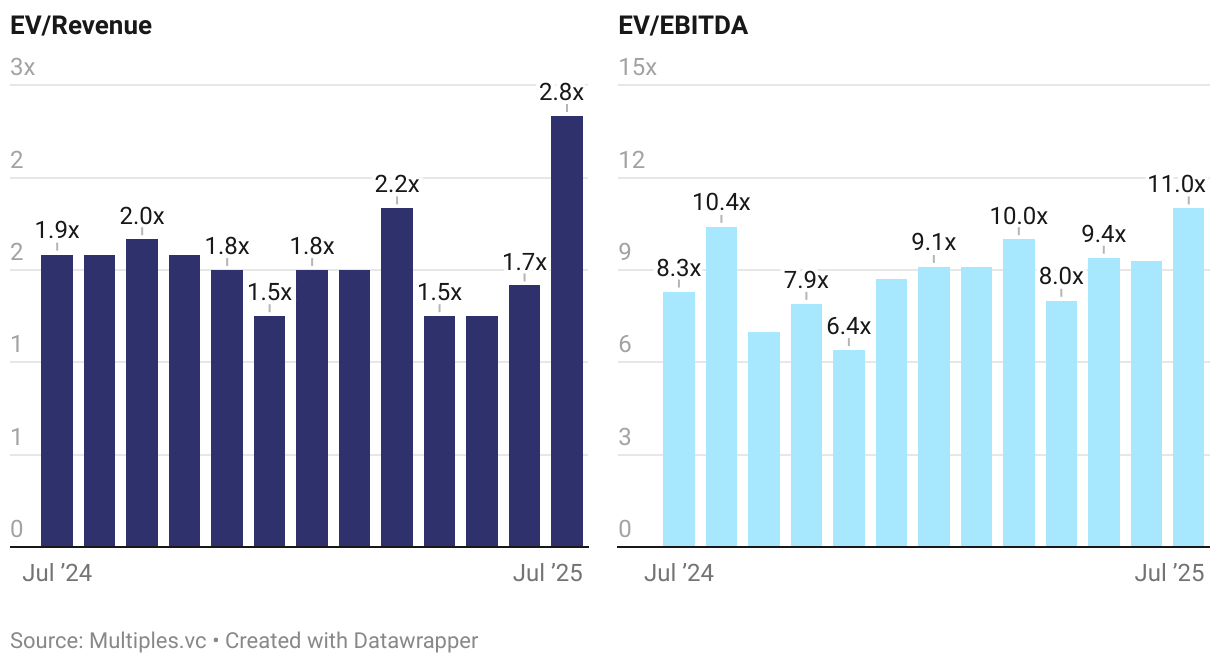
How have EV/revenue multiples evolved across telecom verticals?
Flat revenue multiples for mature verticals (telco service providers), but more growth across satellites, data centers and IoT hardware.
Which telecom verticals command the highest EV/EBITDA multiples?
Data centers and IoT represent critical infrastructure for next-gen tech: superior growth, expanding margin profile and operational leverage (data centers); platform economics and ecosystem lock-in (IoT)
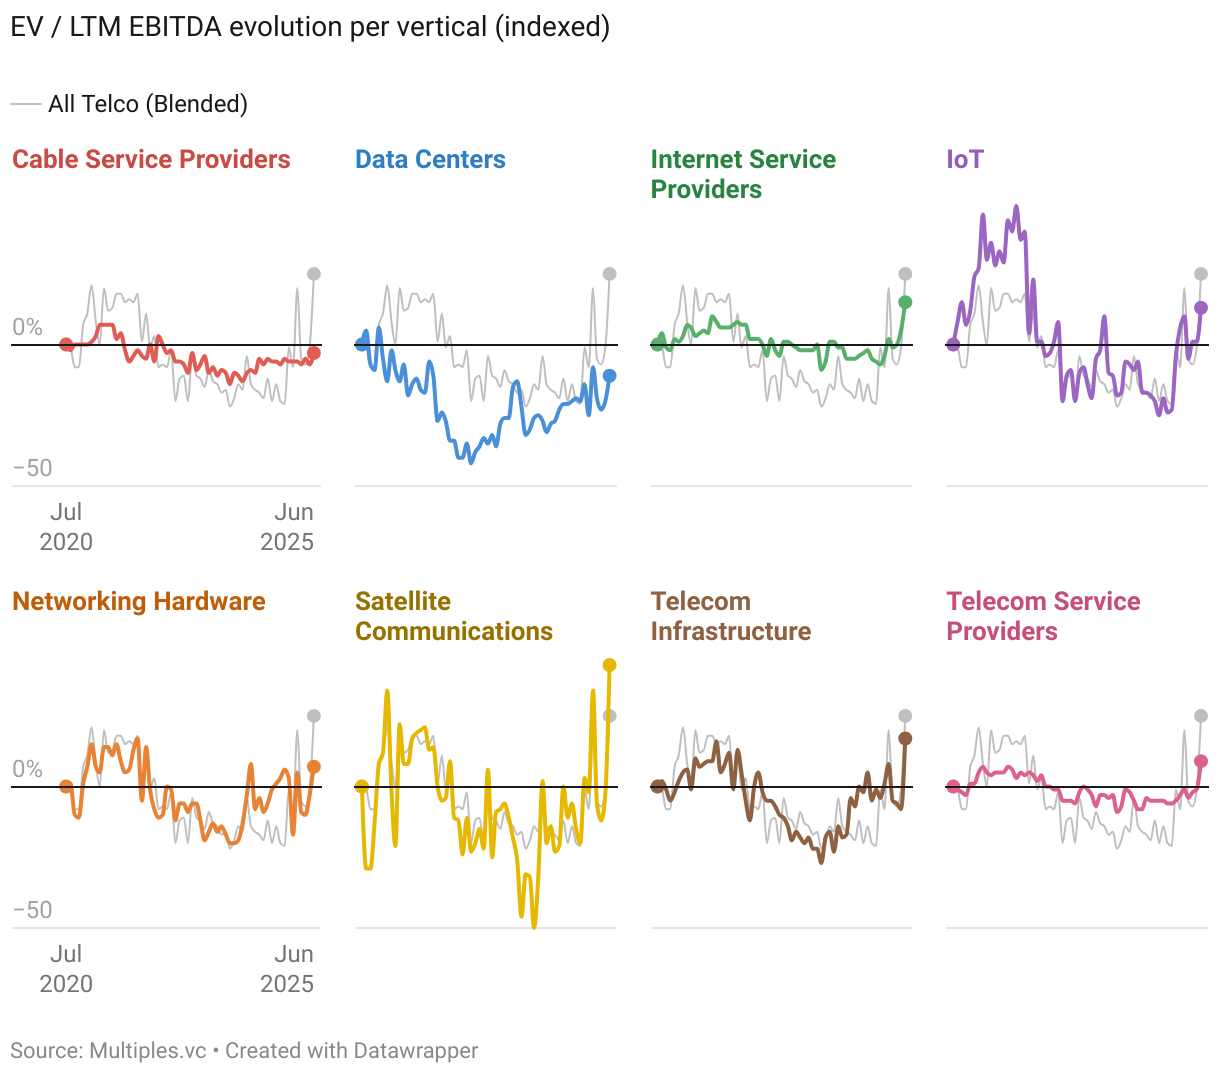
How have EBITDA multiples evolved across telecom verticals?
Public IoT companies significantly outperform the broader telecom sector, grew EBITDA multiple by 62% in the last five years.
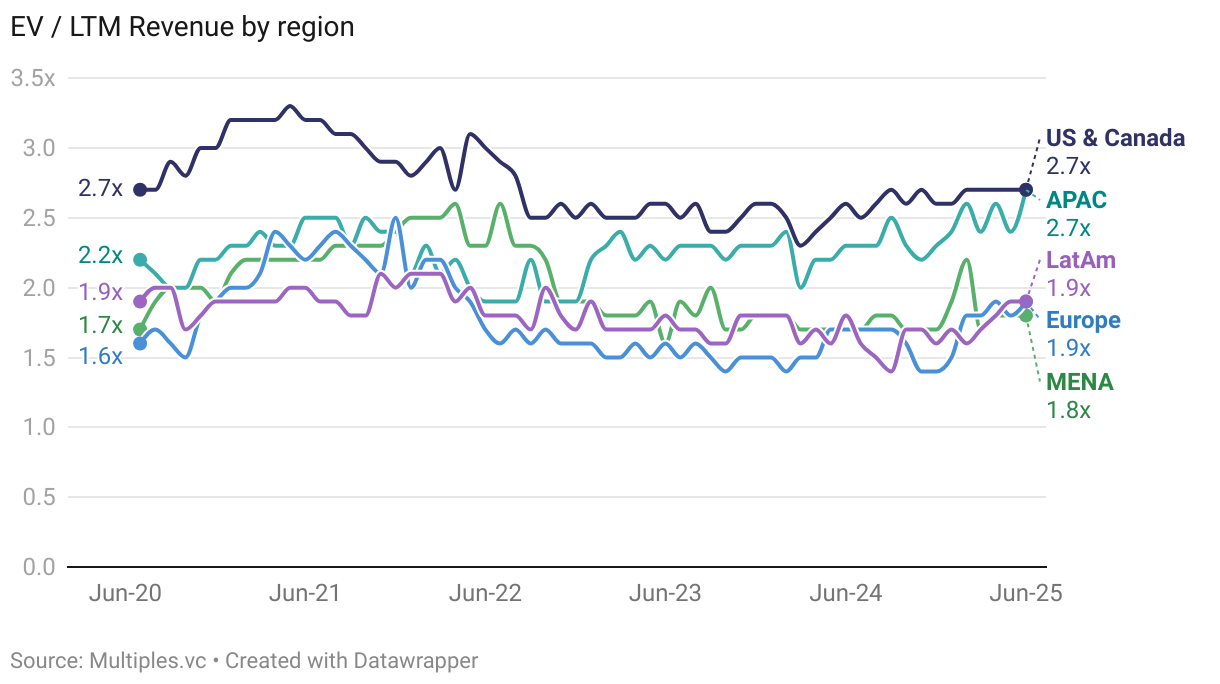
How do telecom EV/revenue multiples vary by region?
Asian and American telcos trade higher than European counterparts.
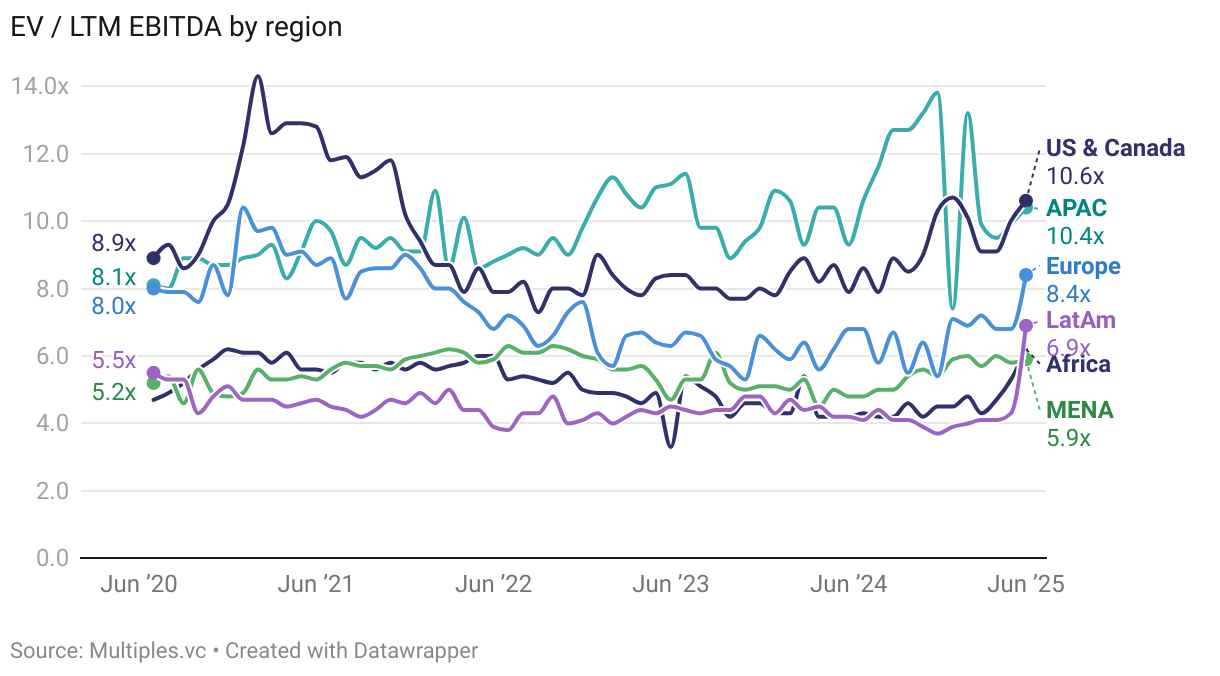
How do telecom EBITDA multiples compare across regions?
Growth across all geographies, APAC and US comps trade at similar levels.
What are current telecom sector valuations?
Data centers valued the highest by public markets.
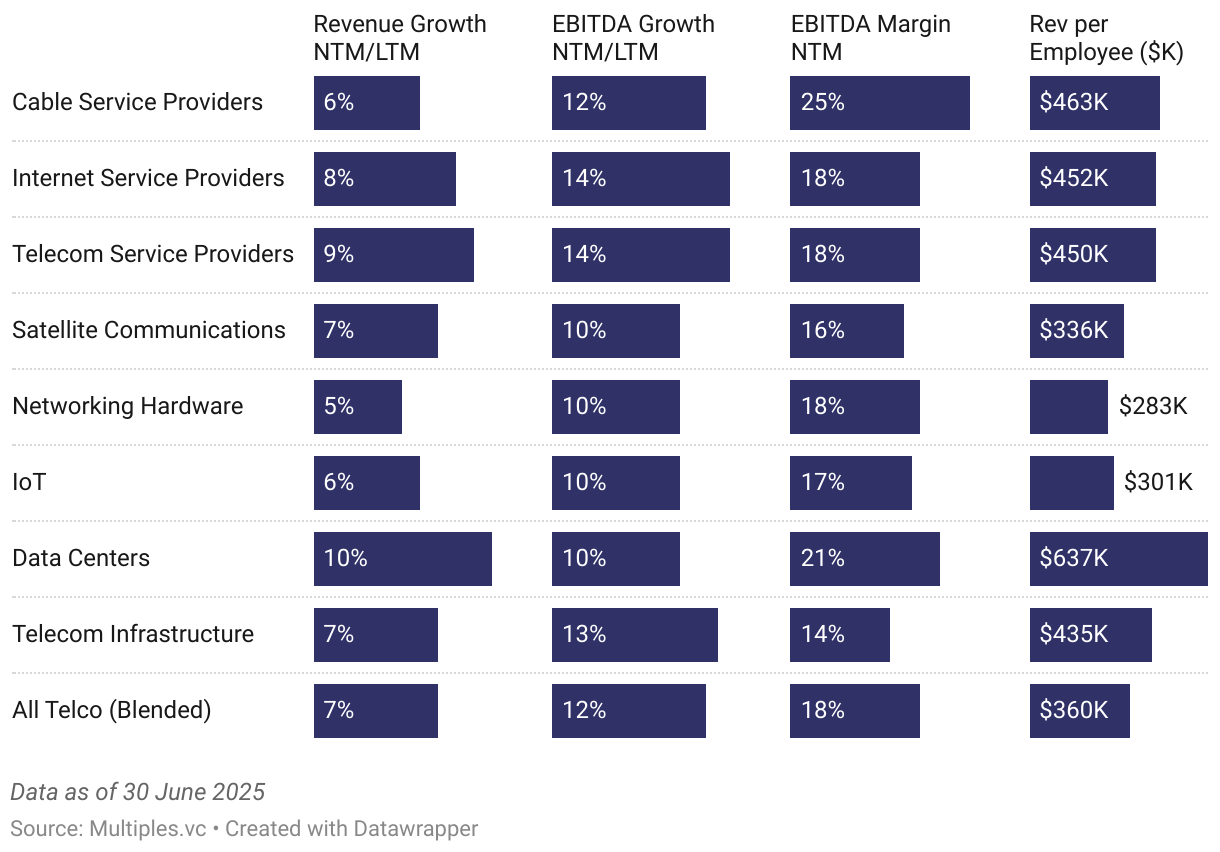
How do growth rates and margins compare across telecom sectors?
'Hot' telco sectors like IoT and satellites trade profitability for growth, mature verticals (TSPs, infra) highly profitable but flat top-line.
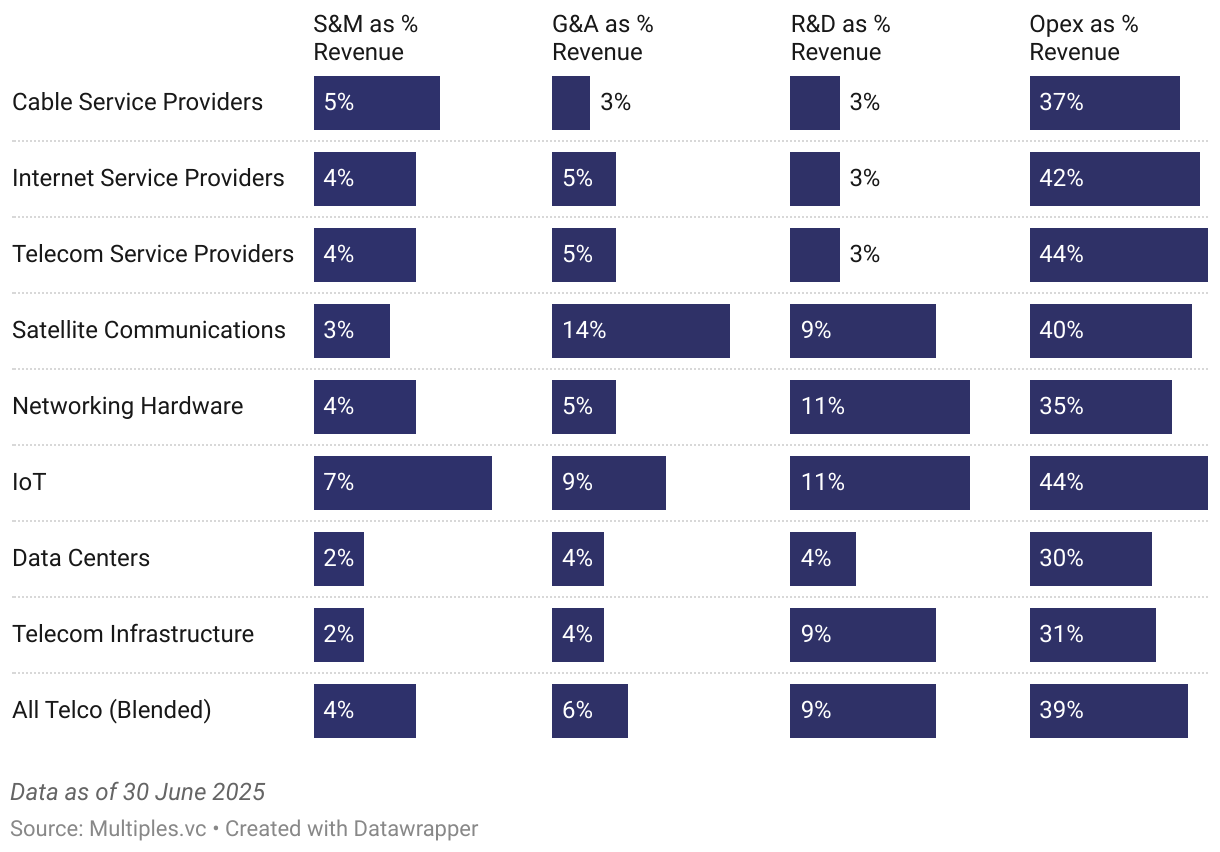
What is the expense structure across telecom sectors?
Very little spend on marketing initiatives, opex is the biggest cost factor for all telco subverticals.
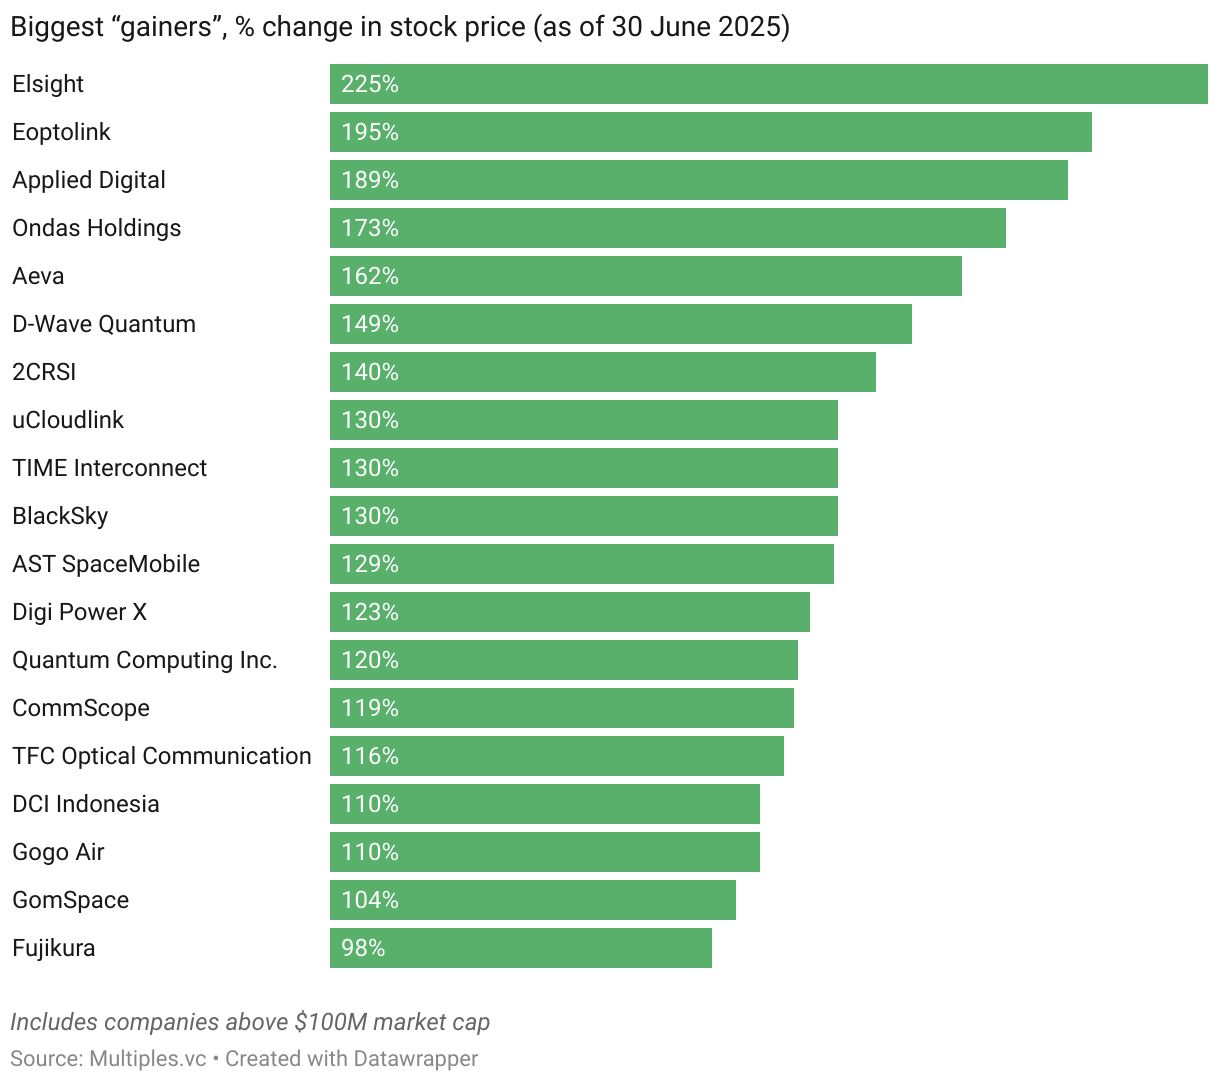
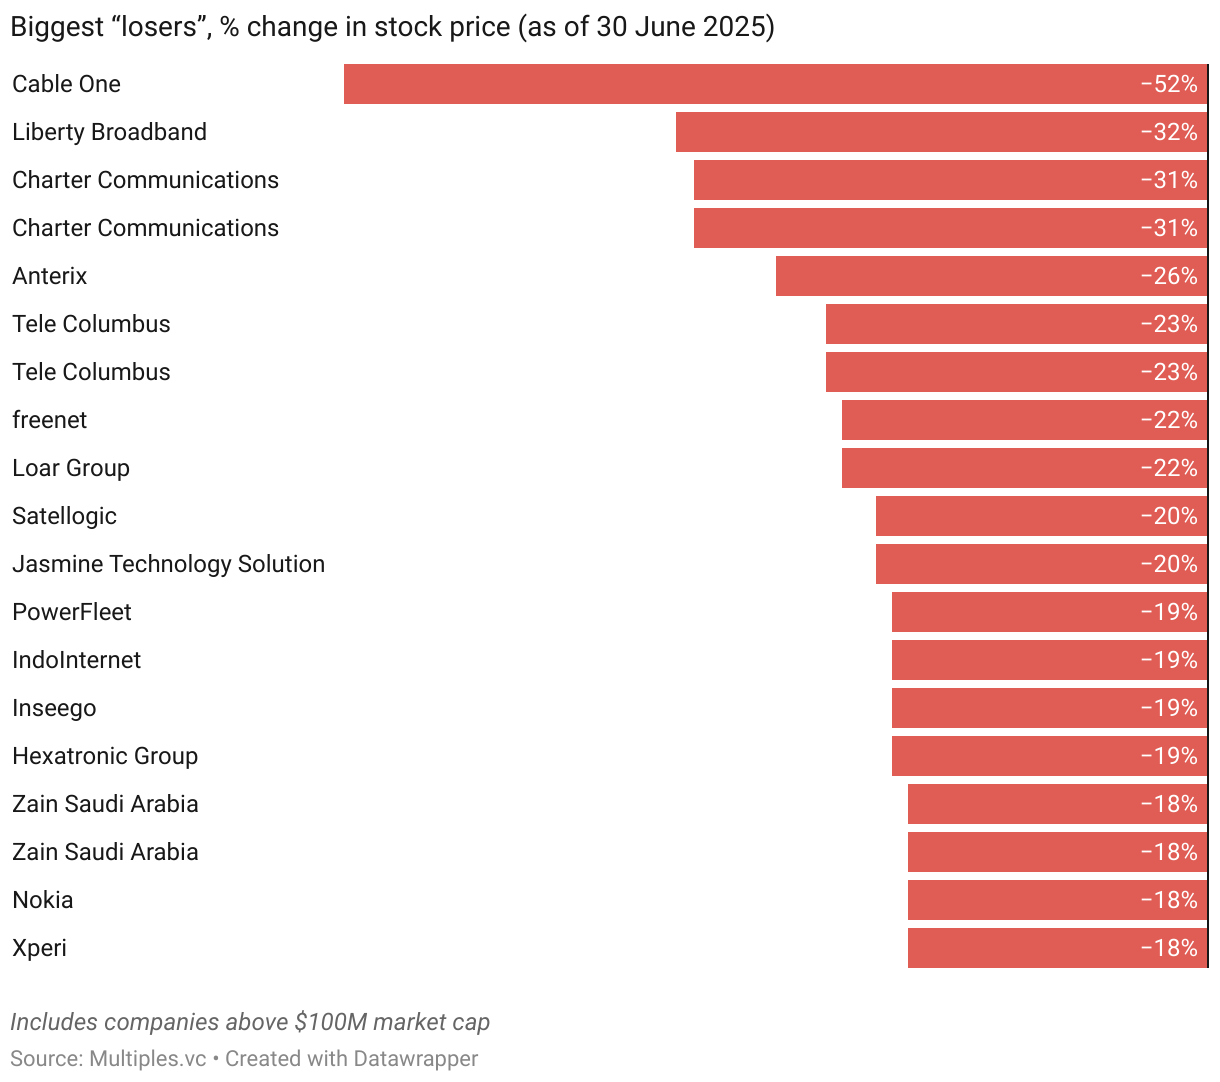
Which telecom stocks performed best and worst in Q2 2025?
Largest stock price 'gainers' and 'losers' in the last three months.
M&A Activity
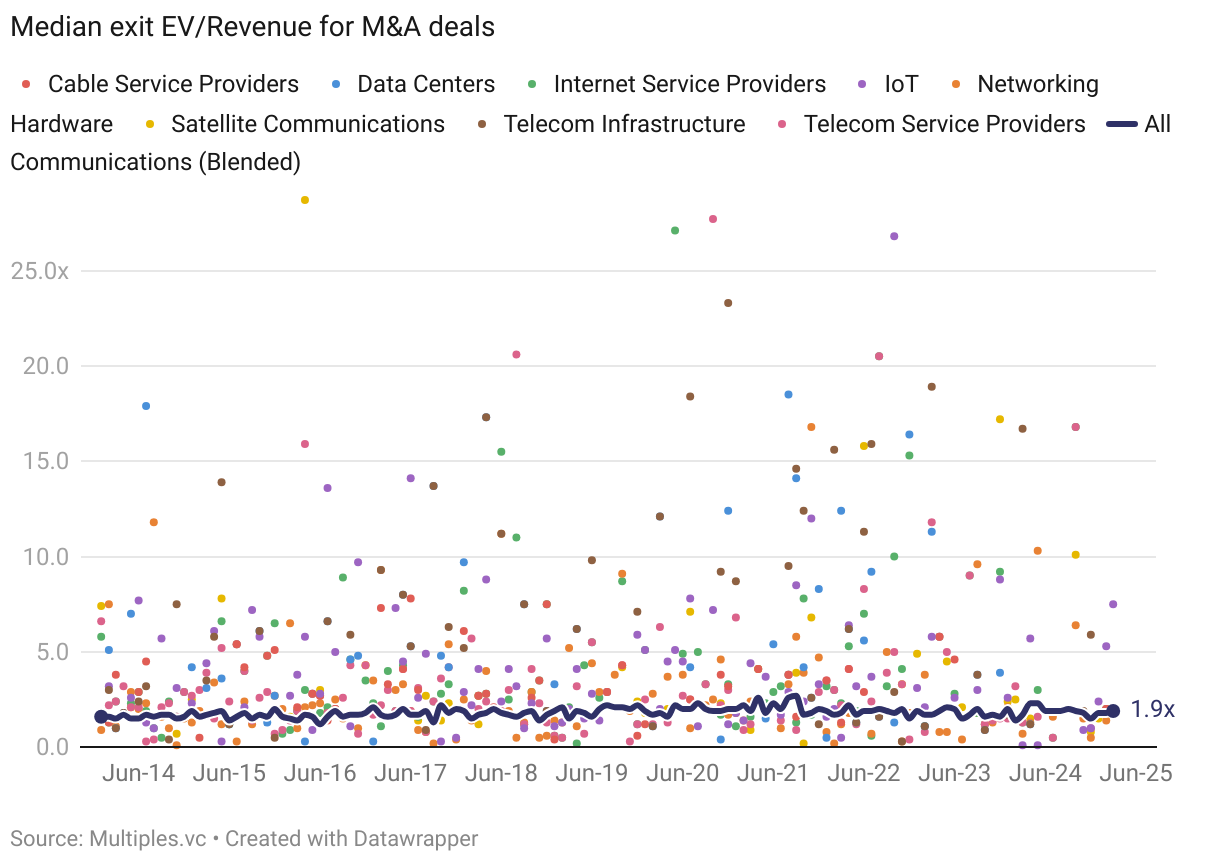
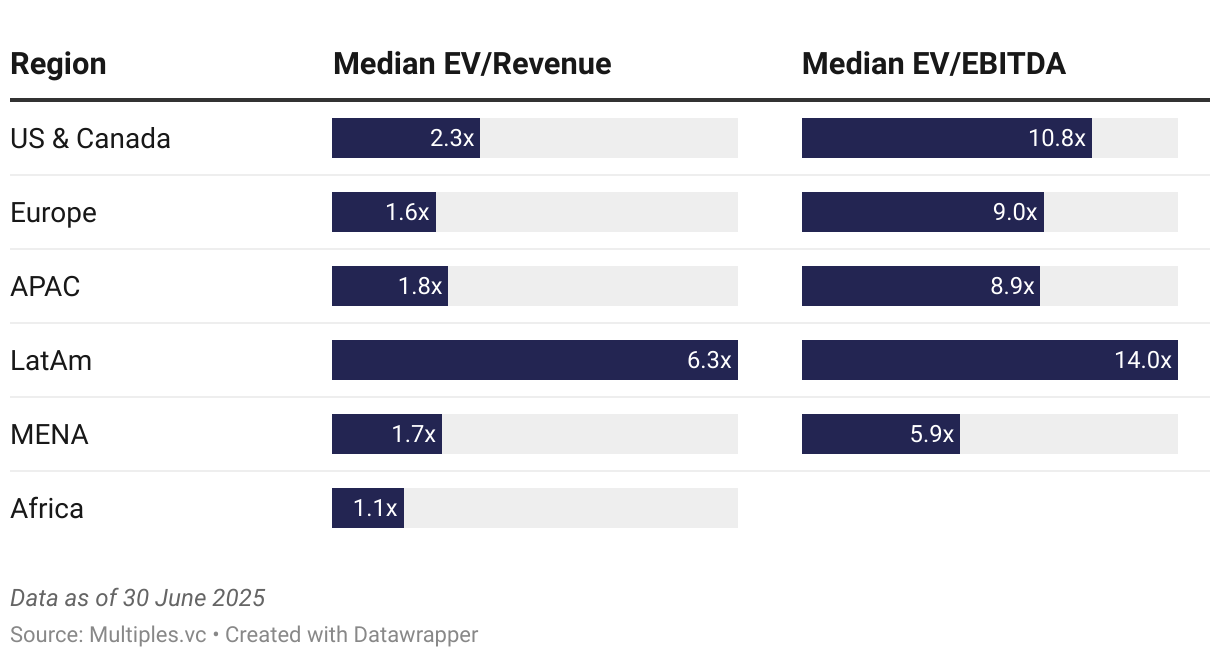
What are telecom M&A exit valuations?
Fairly flat both exit revenue and EBITDA multiples.
Which telecom verticals command the highest M&A exit revenue multiples?
Telco is a mature market: flat exit revenue multiples, few deals valued at premium (mostly software/hybrid solutions with lower capex needs and bigger monetization upside).
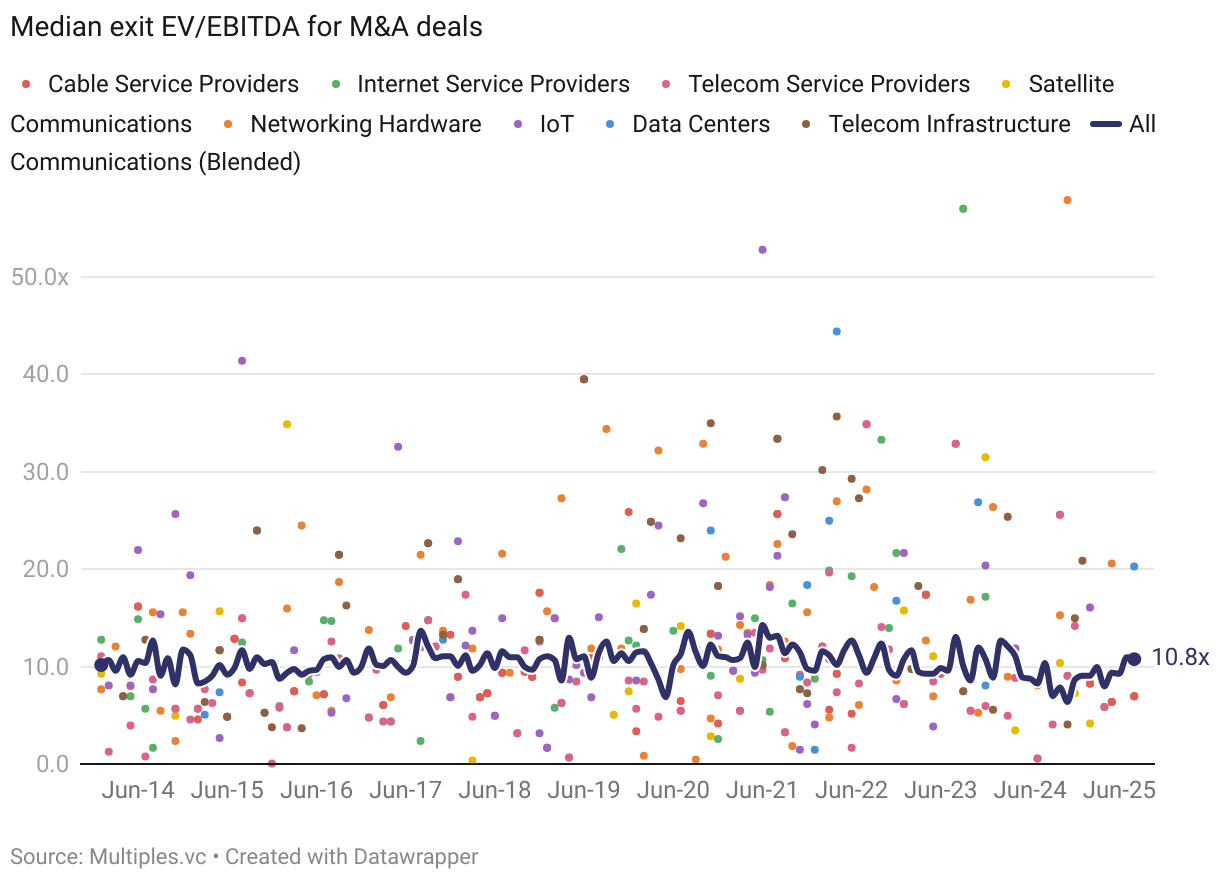
What are M&A exit EBITDA multiples by telecom vertical?
Median EV/EBITDA remain relatively stable, data centers and IoT tend to command higher multiples on the high profitability promises.
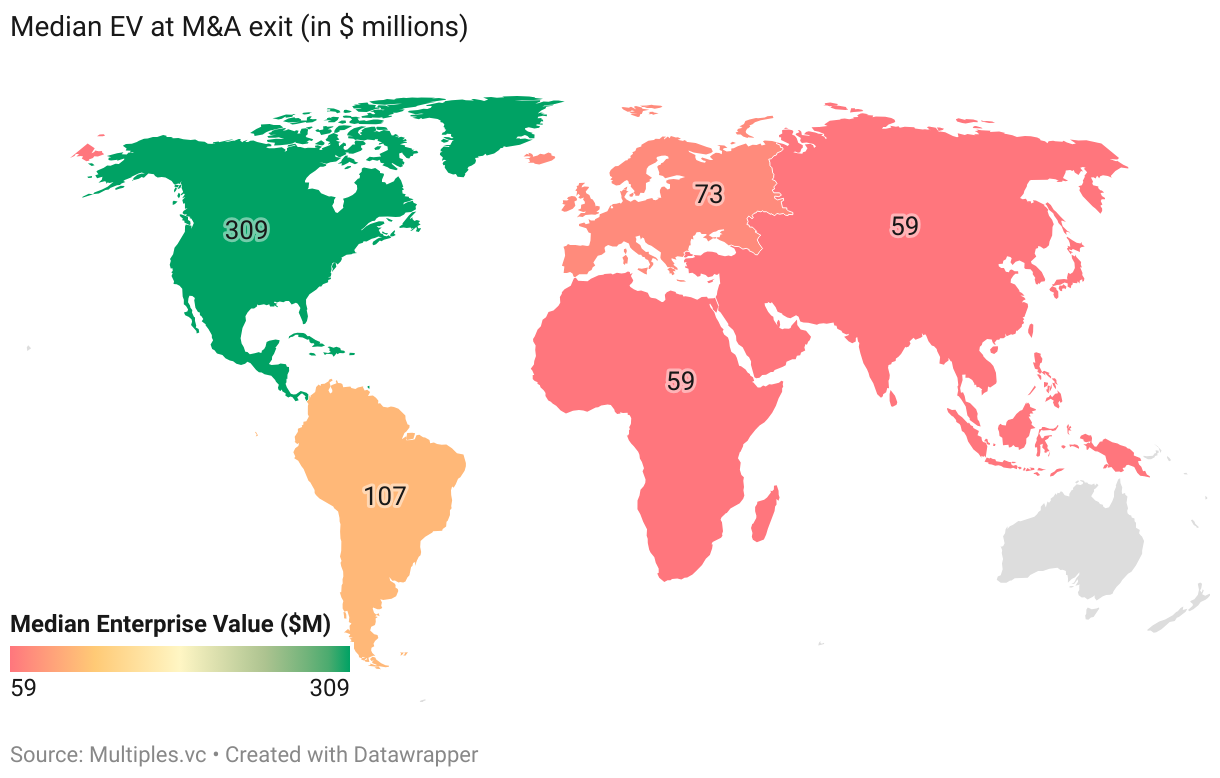
How do telecom M&A valuations vary by region?
Biggest M&A deals in telco are happening in the US, followed by Europe. Higher valuations in the US vs. Europe and APAC. Latin America artificially high due to limited deal volume.
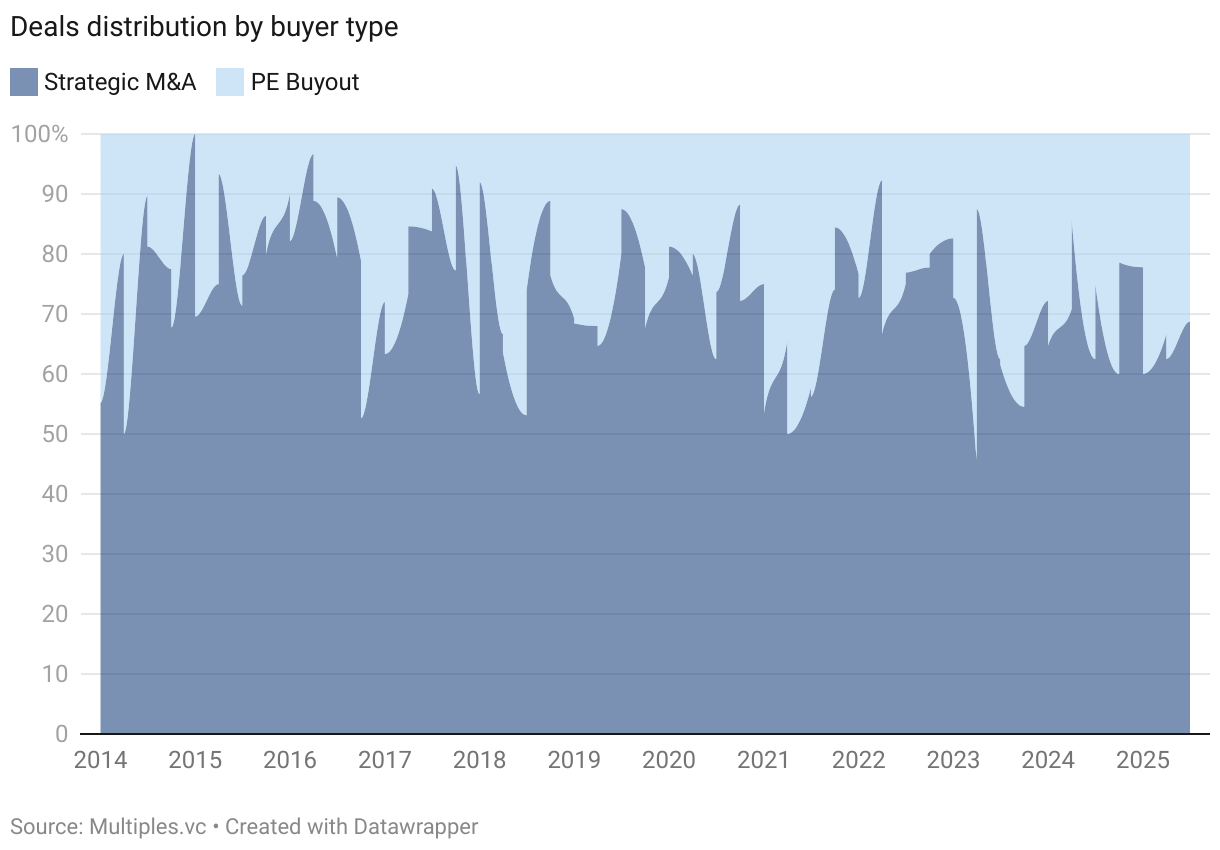
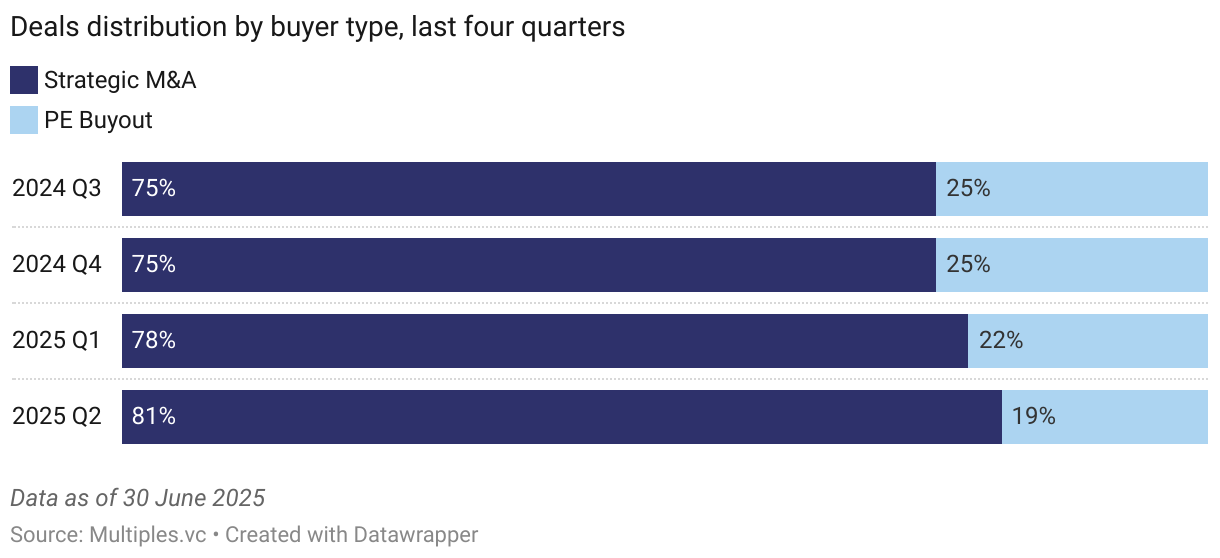
Who are the main buyers in telecom M&A?
Strategic buyers dominate telco M&A due to scale economics and operational synergies.
VC Activity
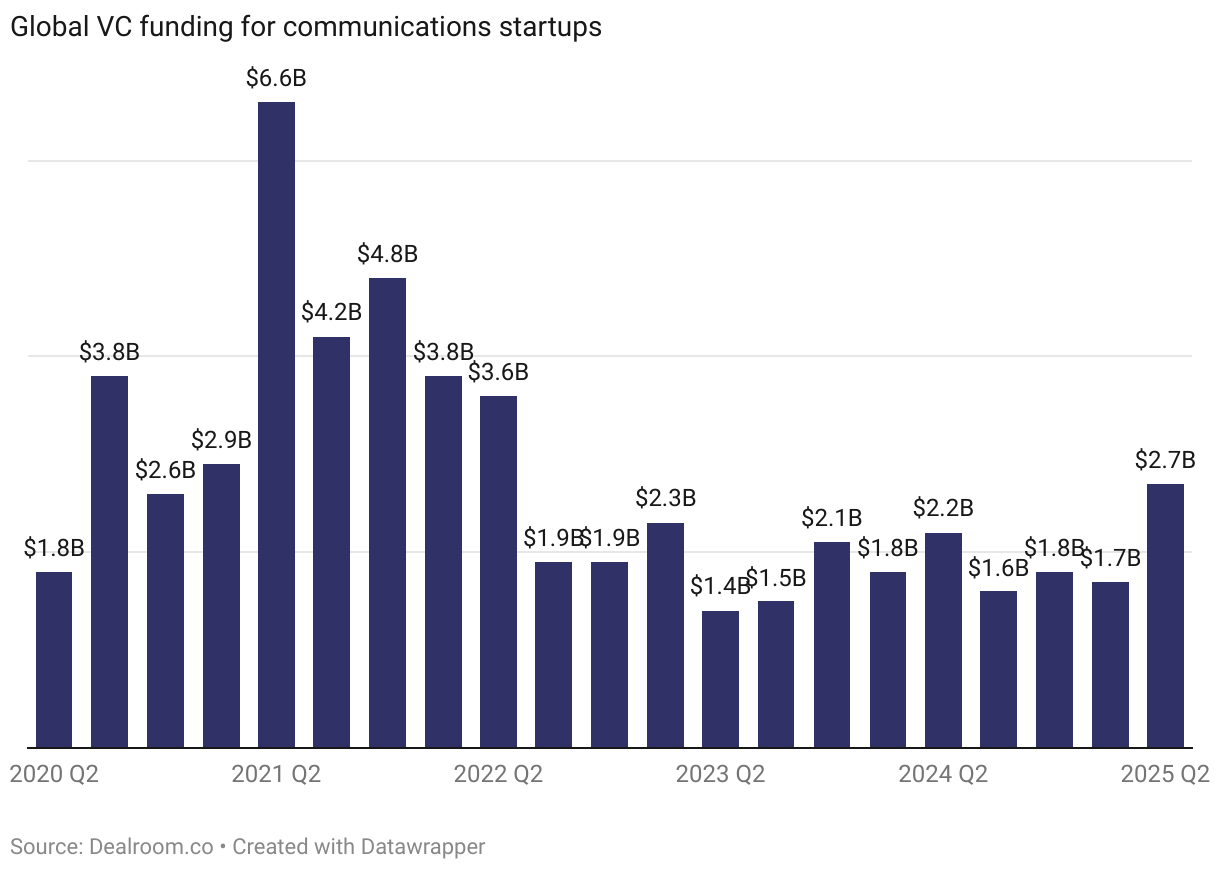
How much VC funding telecom startups raised in Q2 2025?
Overall funding into startups disrupting communications sector is up 22% year-on-year.
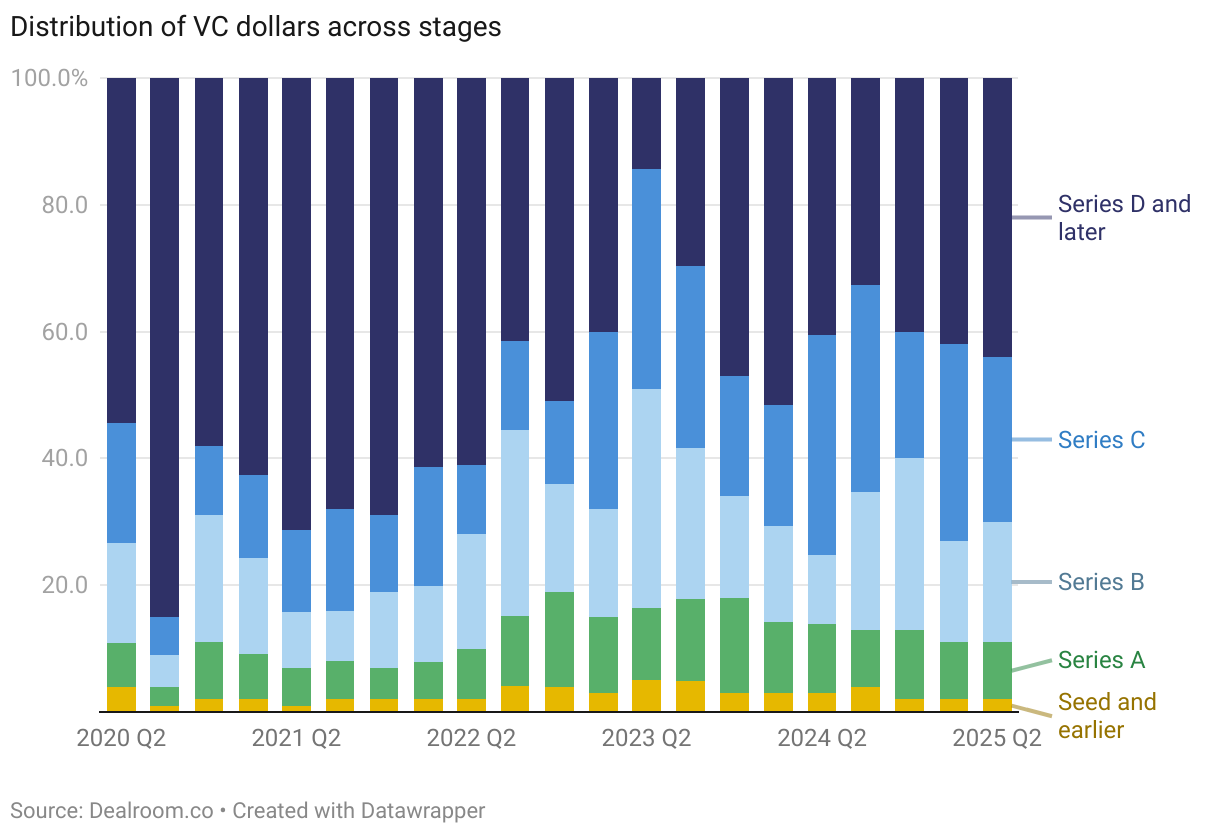
How is telecom VC funding distributed across stages?
44% of venture capital went to communications startups raising mega rounds - $100M and above.
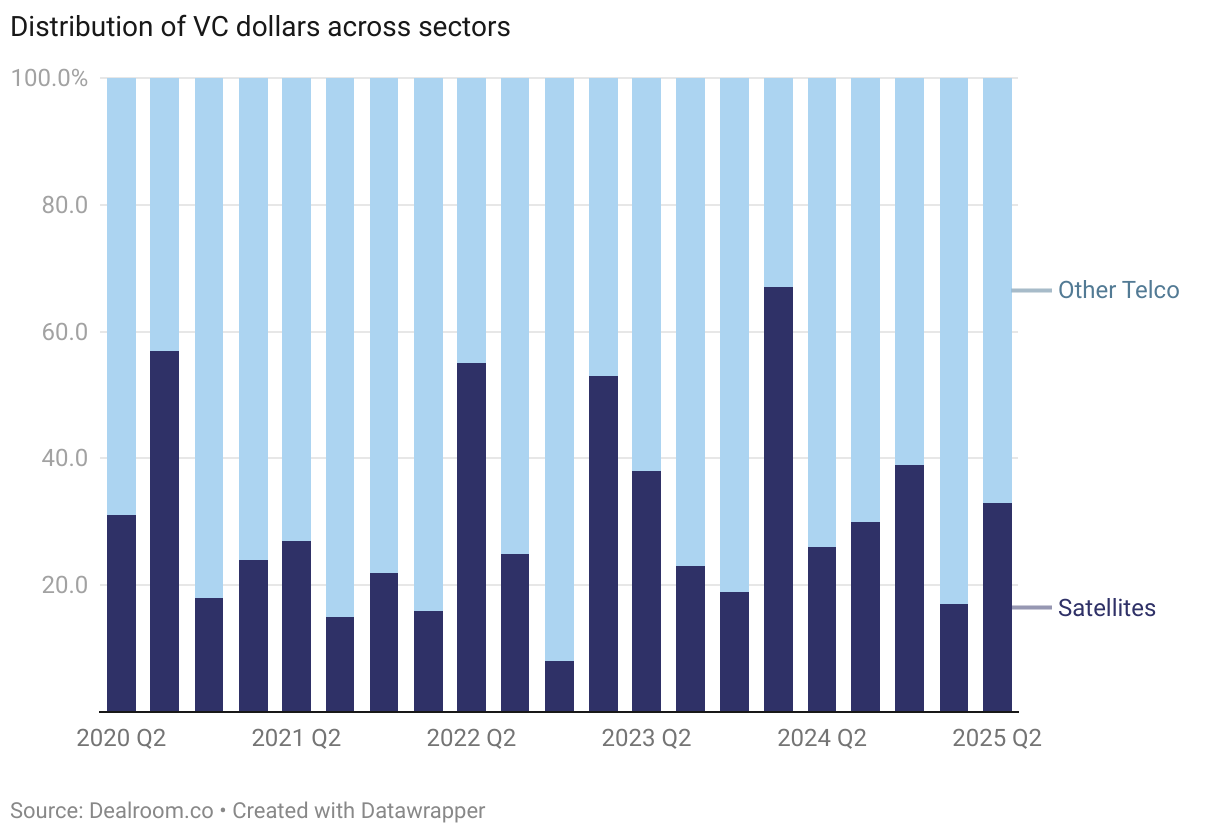
Which telecom sectors attract the most VC funding?
Space and satellite communications make up the largest portion of venture capital flowing into communications sector.
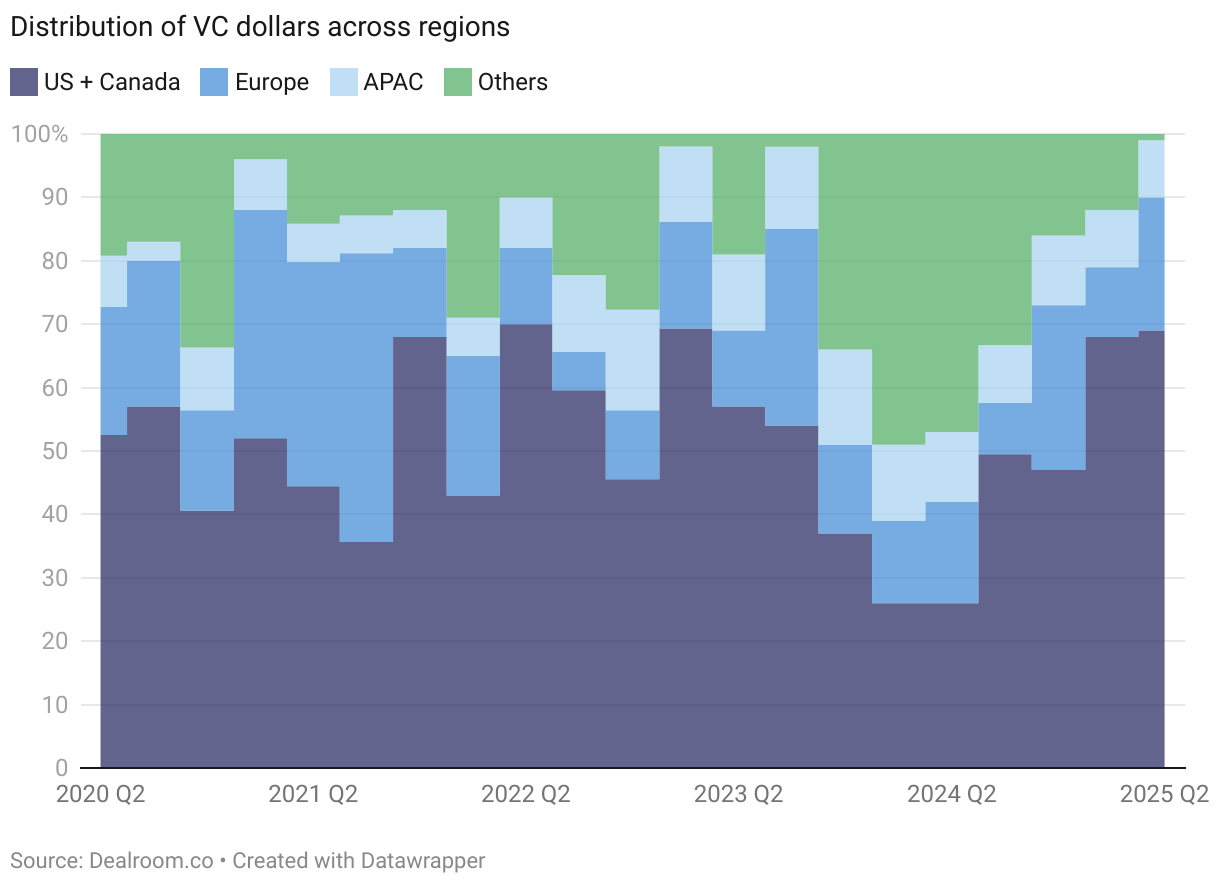
How is telecom VC funding distributed globally?
Gap between the US and Europe is widening again, 70% of all VC dollars went to America in the last quarter.
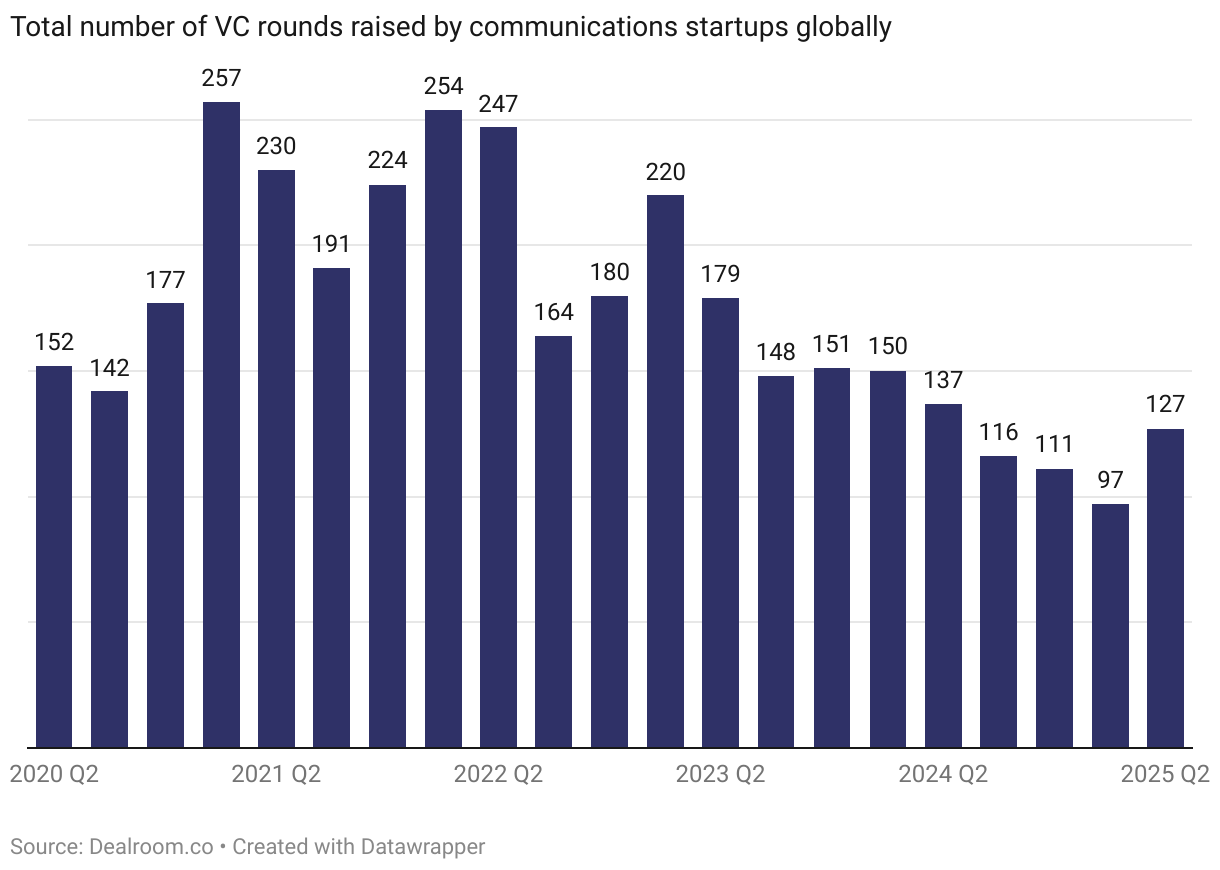
How many telecom VC rounds happened in Q2 2025?
Declining trend in round volume reverted in Q2 2025, but still down 29% vs. two years ago
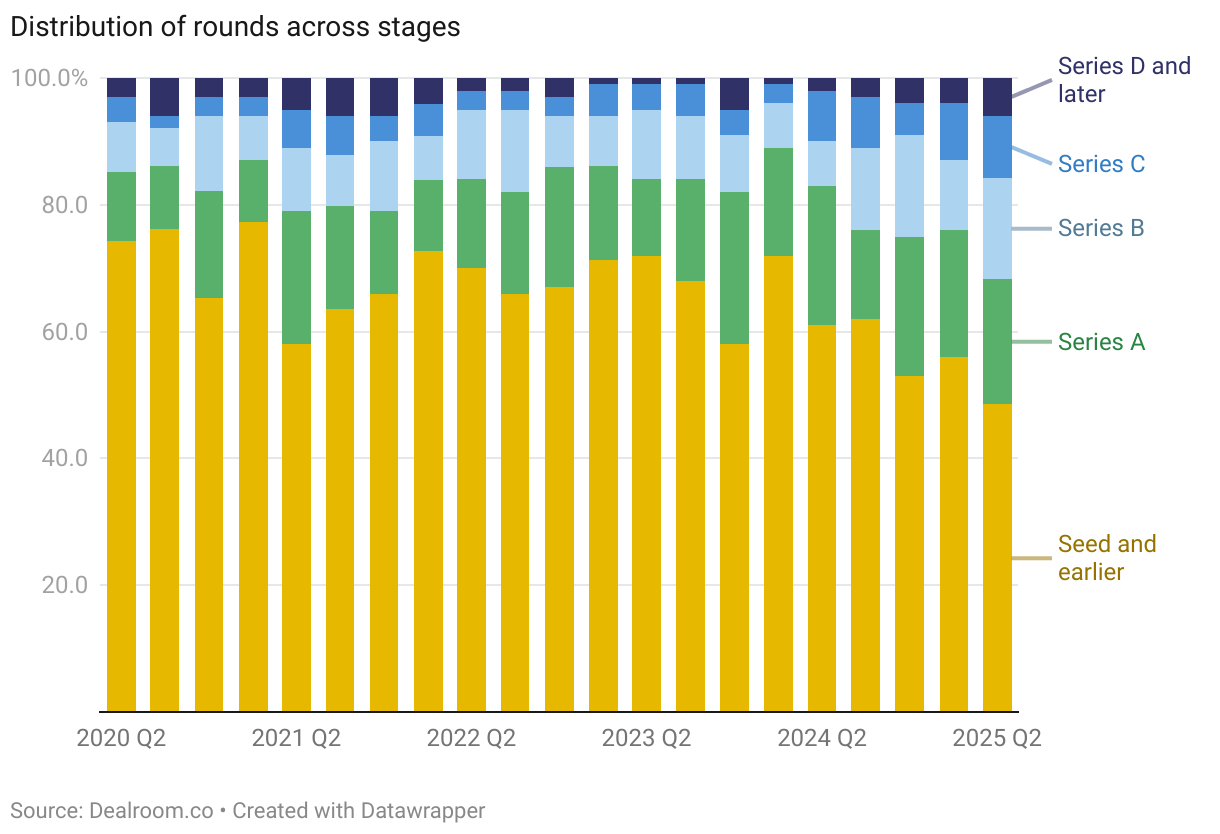
How are telecom VC rounds distributed by stage?
3/4 of all rounds across communications were early stage (pre-seed, seed and series A)
Data and methodology
Underlying data
Multiples is a valuation analytics platform. Public markets data is powered by FactSet and Morningstar, harmonized and enhanced by us. Private transaction data is multi-sourced, aggregated from harvesting public information, agreements with 3rd party providers, proprietary sourcing and data engineering. All data is verified and provided with an extensive manual process (no AI involved). This report is built on data that is available at multiples.vc. For more information, please visit multiples.vc or contact us at hi@multiples.vc.
Public companies
The foundation of our public comps are analyst estimates and historical financials, powered by FactSet (consensus analyst estimates) and Morningstar (historical data). Analyst estimates are provided by FactSet by taking input from 50+ equity research analysts (the highest amount across all financial data providers). Data points are calendarized to December where relevant: retrieved data on financial year ends (e.g. FY, FY+1 etc.) are mapped to calendar years (2024A, 2025E etc.) before the appropriate month weights are then applied to prior/future fundamentals. We emphasise valuation multiples and operational ratios, any raw figures are harmonised to USD for comparison purposes.
Private transactions
We source deal data from 3rd party databases, company filings, press releases, and our own proprietary data sets built over years of investment banking careers. We harmonize and unify data in-house to form a unique data set of disclosed transactions. We triple-check deal data through a proprietary red-flagging system, compare with verified online sources, and sense-check with our investment banking team. We exclude undisclosed and suspicious-looking data points. Our dataset is continuously monitored for accuracy. EV calculation: if data permits, we apply our own logic to get to the EV. For example, for a large M&A deal with available information on the target's net debt, we might adjust a valuation to fully reflect an accurate EV. In all other cases, we take the reported valuation as the numerator. Financials: we source LTM revenue and LTM EBITDA data from company filings, press releases, or other verified sources. If LTM data is unavailable, we take the 'next best-fit' period (run-rate or calendar year), provided it makes sense in a given case. For example, if a deal closed in November 2024, we might take full-year 2024 revenue as a revenue benchmark.
Past report versions
Communications Sector Update - Q1 2025